| Red | Green | Blue | |
| z | 17.64 | ||
| znorm | Inf | ||
| sky | -Inf | -Inf | -NaN |
| S/N | 38.6 | 53.7 | 67.1 |
| S/N(c) | 12.0 | 86.7 | 70.0 |
| SN(E/C) |
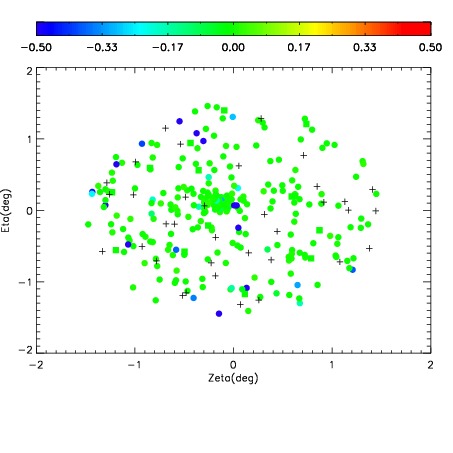
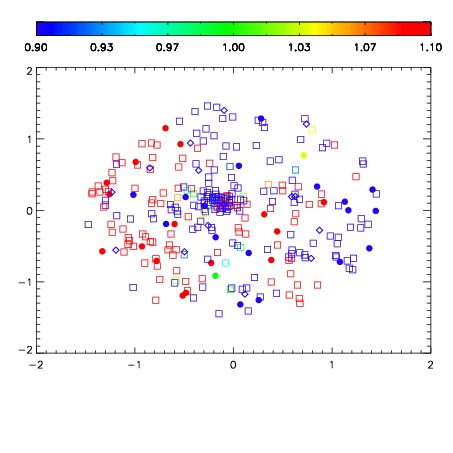
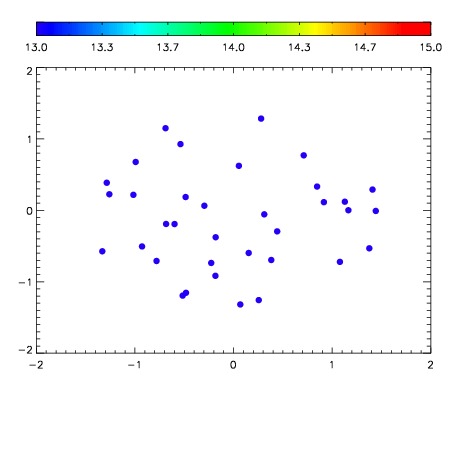

| Frame | Nreads | Zeropoints | Mag plots | Spatial mag deviation | Spatial sky 16325A emission deviations (filled: sky, open: star) | Spatial sky continuum emission | Spatial sky telluric CO2 absorption deviations (filled: H < 10) | |||||||||||||||||||||||
| 0 | 0 |
|
|
|
|
|
|
| IPAIR | NAME | SHIFT | NEWSHIFT | S/N | NAME | SHIFT | NEWSHIFT | S/N |
| 0 | 19680060 | 0.00000 | 0.00000 | 19.7676 | 19680062 | -0.491936 | 0.491936 | 19.7560 |
| 1 | 19680063 | -0.00192506 | 0.00192506 | 19.7891 | 19680061 | -0.491613 | 0.491613 | 19.8214 |