| Red | Green | Blue | |
| z | 17.64 | ||
| znorm | Inf | ||
| sky | -NaN | -NaN | -NaN |
| S/N | 41.5 | 58.5 | 70.0 |
| S/N(c) | 22.6 | 68.0 | 14.6 |
| SN(E/C) |
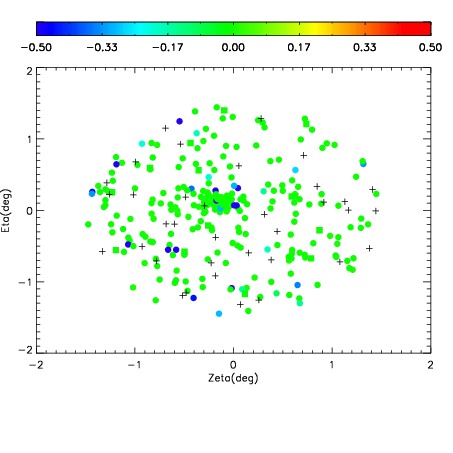
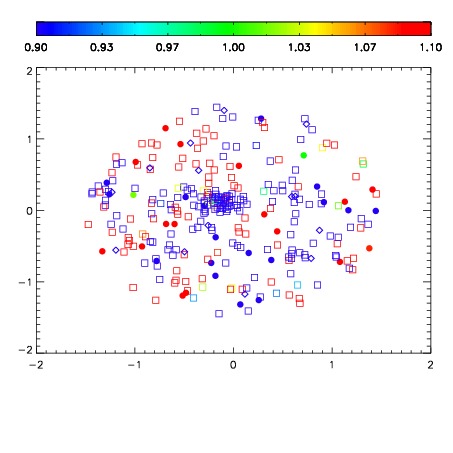
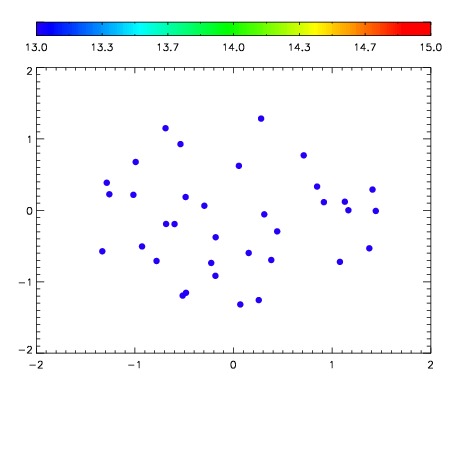

| Frame | Nreads | Zeropoints | Mag plots | Spatial mag deviation | Spatial sky 16325A emission deviations (filled: sky, open: star) | Spatial sky continuum emission | Spatial sky telluric CO2 absorption deviations (filled: H < 10) | |||||||||||||||||||||||
| 0 | 0 |
|
|
|
|
|
|
| IPAIR | NAME | SHIFT | NEWSHIFT | S/N | NAME | SHIFT | NEWSHIFT | S/N |
| 0 | 19720041 | 0.492306 | 0.00000 | 19.8676 | 19720043 | -0.00146543 | 0.493771 | 19.8515 |
| 1 | 19720042 | 0.491363 | 0.000943005 | 19.8417 | 19720040 | 0.00000 | 0.492306 | 19.8394 |