| Frame | Nreads | Zeropoints | Mag plots
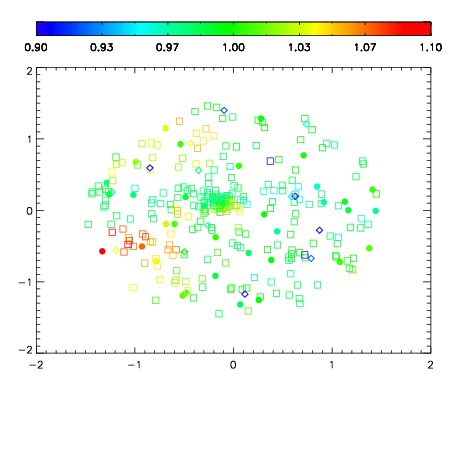
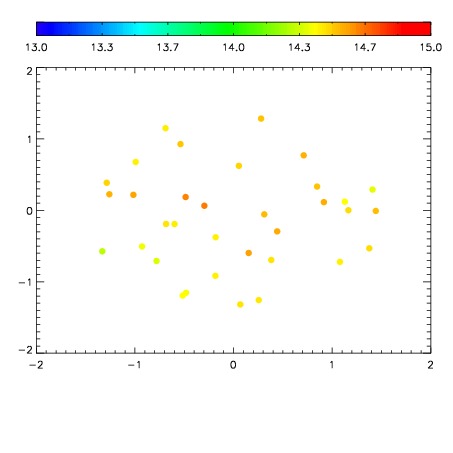
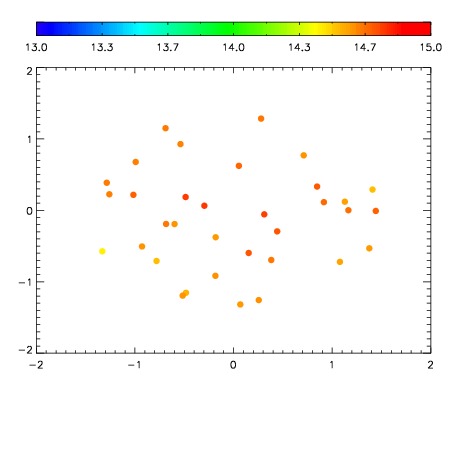
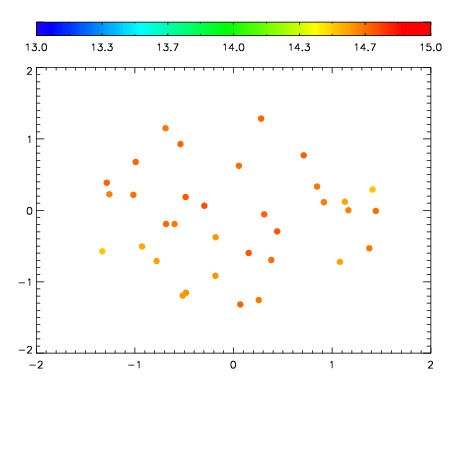
| Spatial mag deviation
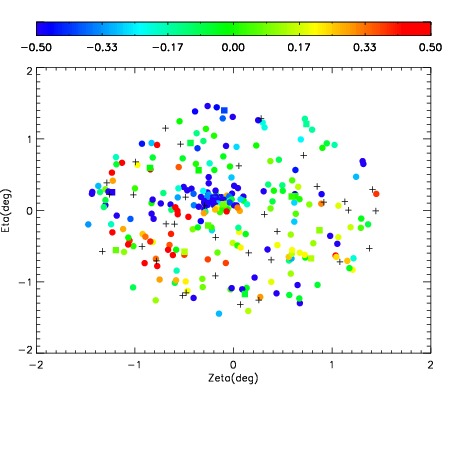
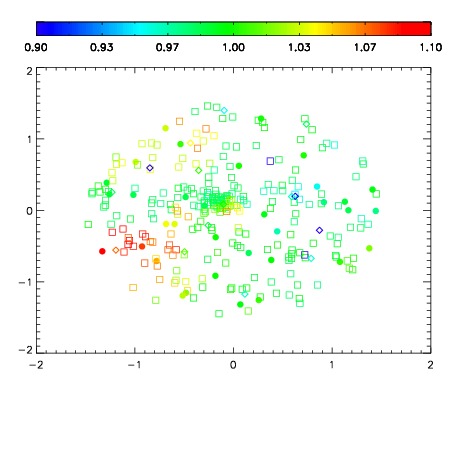
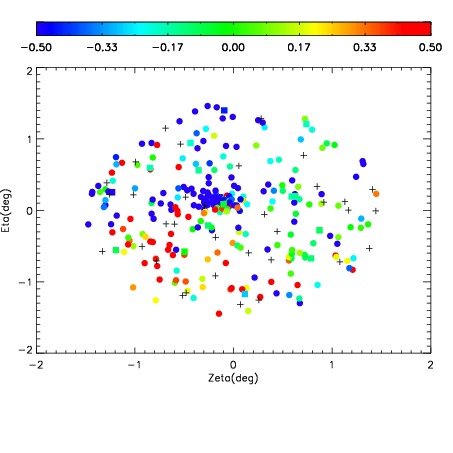
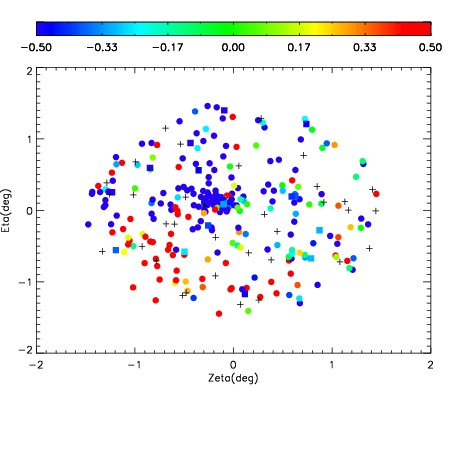
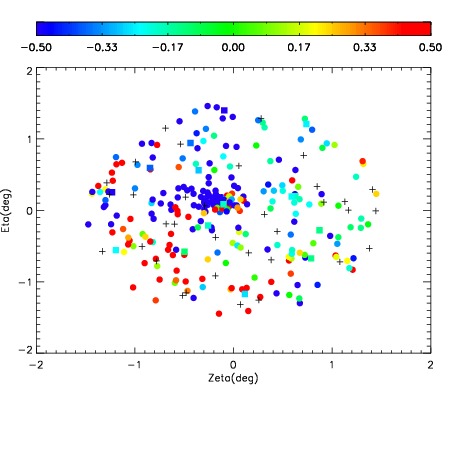
| Spatial sky 16325A emission deviations (filled: sky, open: star)
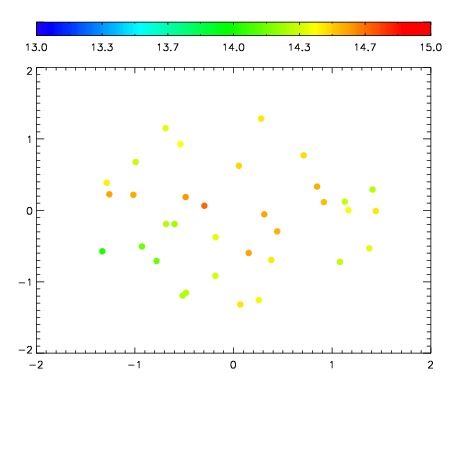
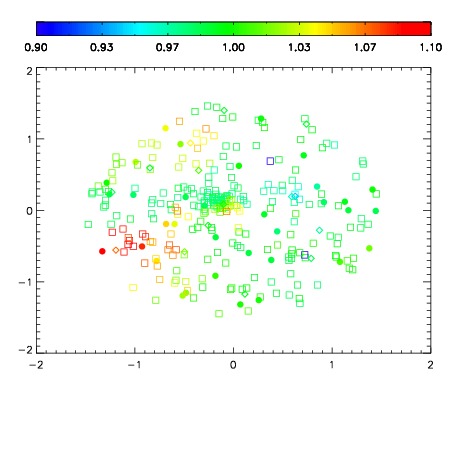
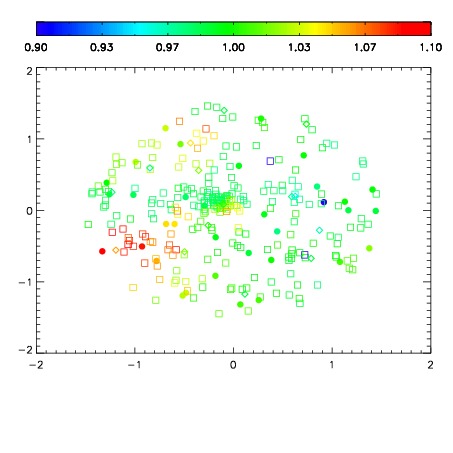
| Spatial sky continuum emission
| Spatial sky telluric CO2 absorption deviations (filled: H < 10)
|
| 19750046
| 94
| | Red | Green | Blue
| | z | | 18.73
| | znorm | | 13.79
| | sky | 14.7 | 14.4 | 14.7
| | S/N | 17.9 | 24.5 | 29.3
| | S/N(c) | 20.4 | 13.8 | 7.8
| | SN(E/C) 0.85
|
| 
| 
| 
| 
| 
|
| 19750047
| 94
| | Red | Green | Blue
| | z | | 17.95
| | znorm | | 13.02
| | sky | 14.6 | 14.5 | 14.8
| | S/N | 11.6 | 16.3 | 19.5
| | S/N(c) | 13.0 | 9.1 | 5.2
| | SN(E/C) 0.89
|
| 
| 
| 
| 
| 
|
| 19750048
| 94
| | Red | Green | Blue
| | z | | 17.54
| | znorm | | 12.61
| | sky | 14.7 | 14.5 | 14.7
| | S/N | 9.4 | 13.4 | 16.0
| | S/N(c) | 10.5 | 7.5 | 4.3
| | SN(E/C) 0.91
|
| 
| 
| 
| 
| 
|
| 19750049
| 94
| | Red | Green | Blue
| | z | | 17.13
| | znorm | | 12.20
| | sky | 14.6 | 14.6 | 15.0
| | S/N | 6.5 | 9.9 | 11.9
| | S/N(c) | 7.4 | 5.6 | 3.2
| | SN(E/C) 0.98
|
| 
| 
| 
| 
| 
|
| 19750050
| 94
| | Red | Green | Blue
| | z | | 16.33
| | znorm | | 11.40
| | sky | 14.6 | 14.7 | 15.0
| | S/N | 3.1 | 5.2 | 6.3
| | S/N(c) | 3.6 | 2.9 | 1.7
| | SN(E/C) 1.02
|
| 
| 
| 
| 
| 
|
| 19750051
| 94
| | Red | Green | Blue
| | z | | 16.52
| | znorm | | 11.59
| | sky | 14.6 | 14.7 | 15.0
| | S/N | 4.0 | 6.4 | 8.0
| | S/N(c) | 4.6 | 3.7 | 2.2
| | SN(E/C) 0.97
|
| 
| 
| 
| 
| 
|