| Red | Green | Blue | |
| z | 17.67 | ||
| znorm | Inf | ||
| sky | -Inf | -Inf | -Inf |
| S/N | 15.8 | 22.2 | 27.3 |
| S/N(c) | 19.5 | 13.2 | 7.5 |
| SN(E/C) |
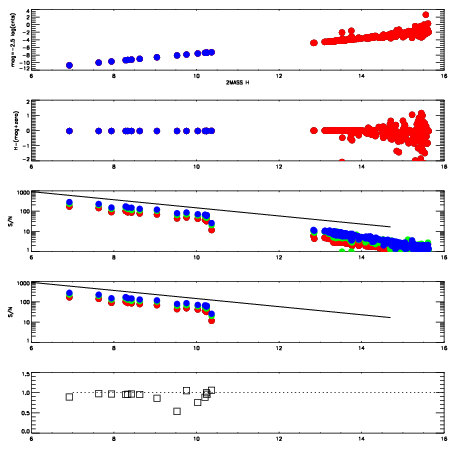


| Frame | Nreads | Zeropoints | Mag plots | Spatial mag deviation | Spatial sky 16325A emission deviations (filled: sky, open: star) | Spatial sky continuum emission | Spatial sky telluric CO2 absorption deviations (filled: H < 10) | |||||||||||||||||||||||
| 0 | 0 |
|
|
|
|
|
|
| IPAIR | NAME | SHIFT | NEWSHIFT | S/N | NAME | SHIFT | NEWSHIFT | S/N |
| 0 | 19750046 | 0.00000 | 0.00000 | 18.7820 | 19750047 | -0.492427 | 0.492427 | 17.9993 |
| 1 | 19750049 | -0.00268099 | 0.00268099 | 17.1468 | 19750048 | -0.492826 | 0.492826 | 17.6345 |
| 2 | 19750050 | -0.00275738 | 0.00275738 | 16.2840 | 19750051 | -0.496708 | 0.496708 | 16.5507 |