| Frame | Nreads | Zeropoints | Mag plots
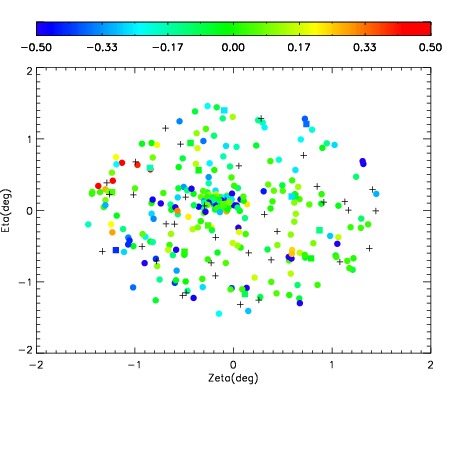
| Spatial mag deviation
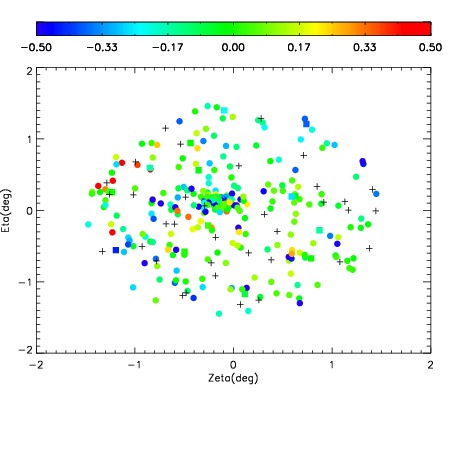
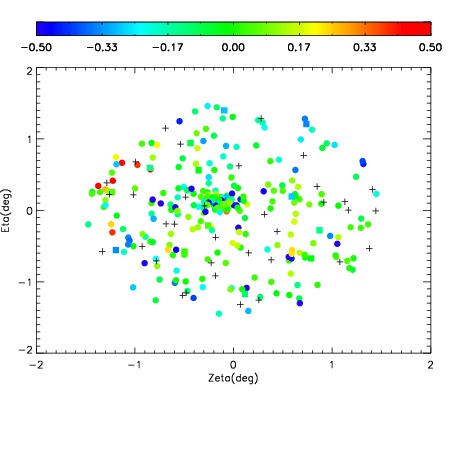
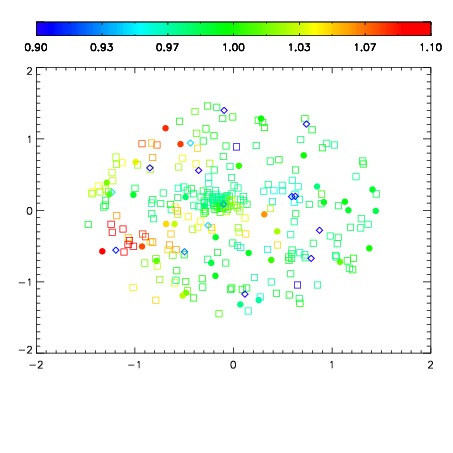
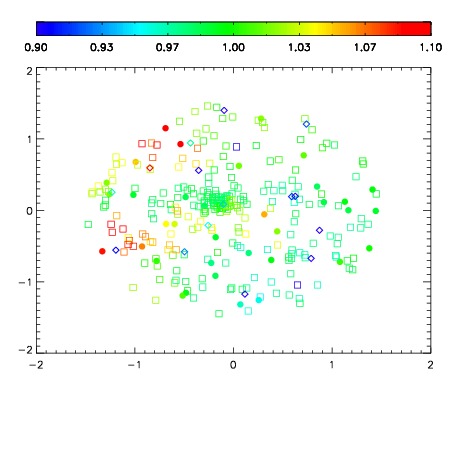
| Spatial sky 16325A emission deviations (filled: sky, open: star)
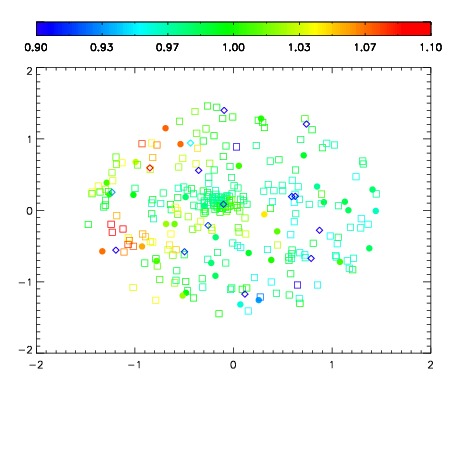
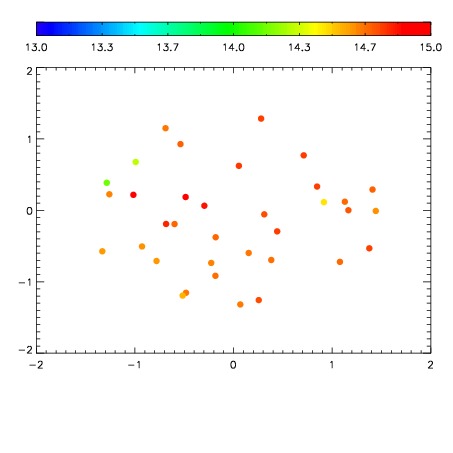
| Spatial sky continuum emission
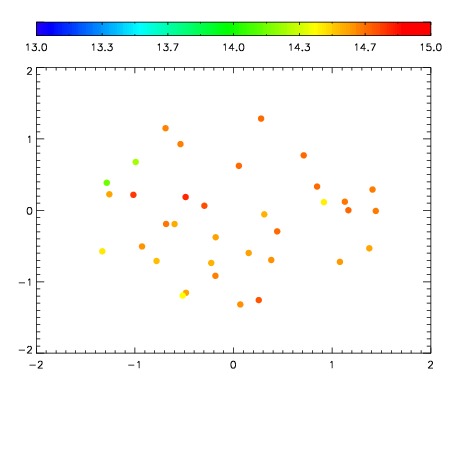
| Spatial sky telluric CO2 absorption deviations (filled: H < 10)
|
| 19900032
| 94
| | Red | Green | Blue
| | z | | 19.84
| | znorm | | 14.91
| | sky | 14.7 | 14.6 | 14.8
| | S/N | 30.3 | 42.6 | 49.7
| | S/N(c) | 22.4 | 13.5 | 62.3
| | SN(E/C) 0.60
|
| 
| 
| 
| 
| 
|
| 19900033
| 94
| | Red | Green | Blue
| | z | | 19.87
| | znorm | | 14.94
| | sky | 14.8 | 14.7 | 14.9
| | S/N | 30.7 | 43.3 | 50.4
| | S/N(c) | 22.5 | 13.7 | 62.8
| | SN(E/C) 0.60
|
| 
| 
| 
| 
| 
|
| 19900034
| 94
| | Red | Green | Blue
| | z | | 19.81
| | znorm | | 14.88
| | sky | 14.7 | 14.7 | 14.9
| | S/N | 30.1 | 42.3 | 49.1
| | S/N(c) | 21.9 | 13.8 | 61.2
| | SN(E/C) 0.63
|
| 
| 
| 
| 
| 
|
| 19900035
| 94
| | Red | Green | Blue
| | z | | 19.86
| | znorm | | 14.93
| | sky | 14.8 | 14.8 | 14.8
| | S/N | 31.0 | 43.6 | 50.5
| | S/N(c) | 22.1 | 13.9 | 62.1
| | SN(E/C) 0.62
|
| 
| 
| 
| 
| 
|