| Red | Green | Blue | |
| z | 17.64 | ||
| znorm | Inf | ||
| sky | -NaN | -Inf | -NaN |
| S/N | 41.0 | 59.1 | 69.3 |
| S/N(c) | 31.4 | 19.4 | 87.8 |
| SN(E/C) |
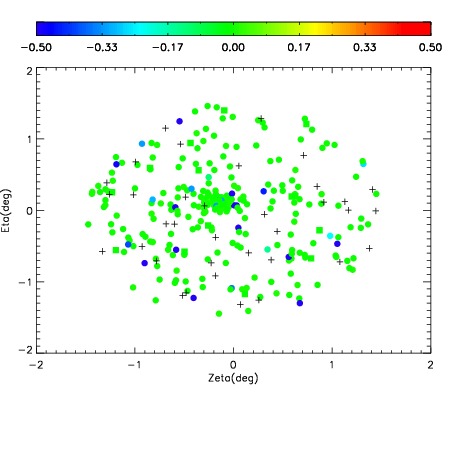
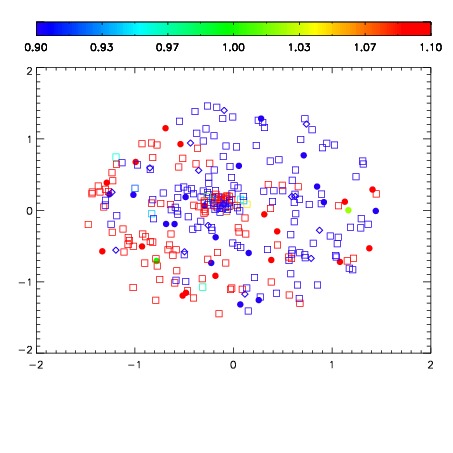
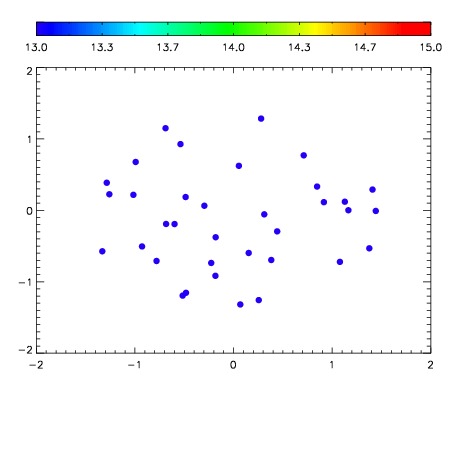

| Frame | Nreads | Zeropoints | Mag plots | Spatial mag deviation | Spatial sky 16325A emission deviations (filled: sky, open: star) | Spatial sky continuum emission | Spatial sky telluric CO2 absorption deviations (filled: H < 10) | |||||||||||||||||||||||
| 0 | 0 |
|
|
|
|
|
|
| IPAIR | NAME | SHIFT | NEWSHIFT | S/N | NAME | SHIFT | NEWSHIFT | S/N |
| 0 | 19900034 | 0.497604 | 0.00000 | 19.8308 | 19900032 | 0.00000 | 0.497604 | 19.8452 |
| 1 | 19900033 | 0.497133 | 0.000471026 | 19.8885 | 19900035 | 0.000478007 | 0.497126 | 19.8593 |