| Red | Green | Blue | |
| z | 17.64 | ||
| znorm | Inf | ||
| sky | -Inf | -NaN | -NaN |
| S/N | 19.5 | 35.8 | 40.4 |
| S/N(c) | 0.0 | 0.0 | 0.0 |
| SN(E/C) |
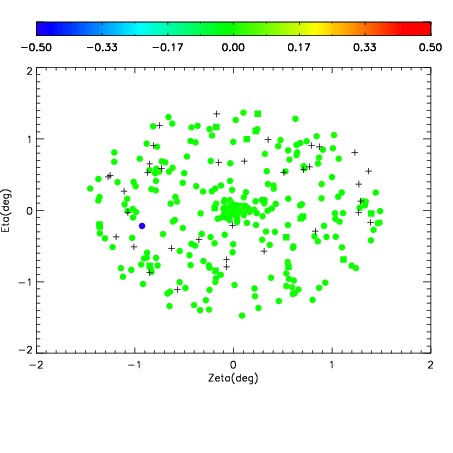
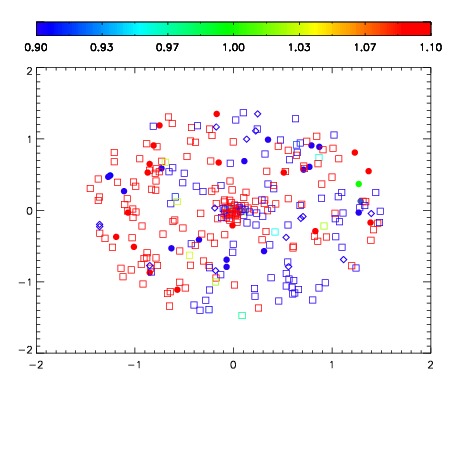
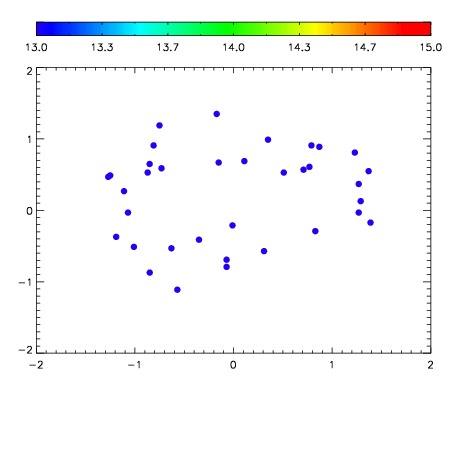

| Frame | Nreads | Zeropoints | Mag plots | Spatial mag deviation | Spatial sky 16325A emission deviations (filled: sky, open: star) | Spatial sky continuum emission | Spatial sky telluric CO2 absorption deviations (filled: H < 10) | |||||||||||||||||||||||
| 0 | 0 |
|
|
|
|
|
|
| IPAIR | NAME | SHIFT | NEWSHIFT | S/N | NAME | SHIFT | NEWSHIFT | S/N |
| 0 | 19400067 | 0.486411 | 0.00000 | 18.6411 | 19400068 | 0.00207318 | 0.484338 | 18.6183 |
| 1 | 19400066 | 0.486204 | 0.000207007 | 18.7621 | 19400065 | 0.00000 | 0.486411 | 18.7668 |
| 2 | 19400071 | 0.483952 | 0.00245902 | 18.6464 | 19400069 | 0.00214900 | 0.484262 | 18.6306 |
| 3 | 19400070 | 0.484564 | 0.00184700 | 18.4990 | 19400072 | 0.000145906 | 0.486265 | 18.4260 |