| Red | Green | Blue | |
| z | 17.64 | ||
| znorm | Inf | ||
| sky | -Inf | -Inf | -Inf |
| S/N | 21.2 | 38.4 | 42.6 |
| S/N(c) | 0.0 | 0.0 | 0.0 |
| SN(E/C) |
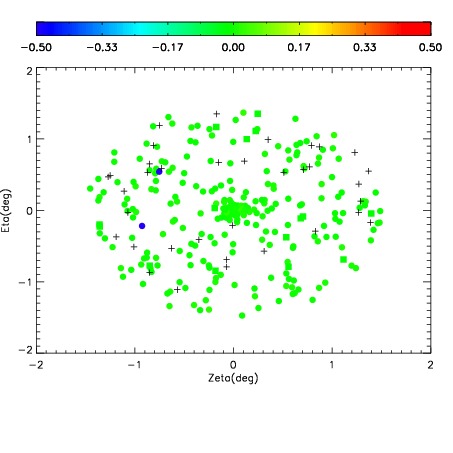
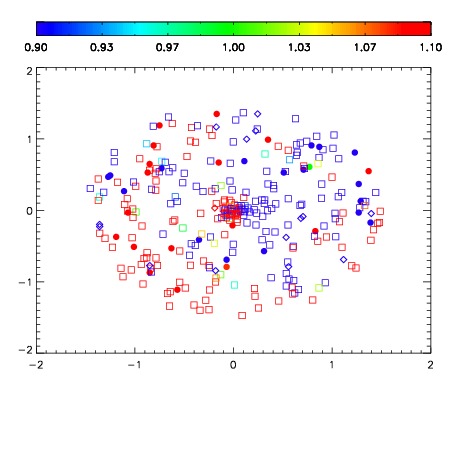
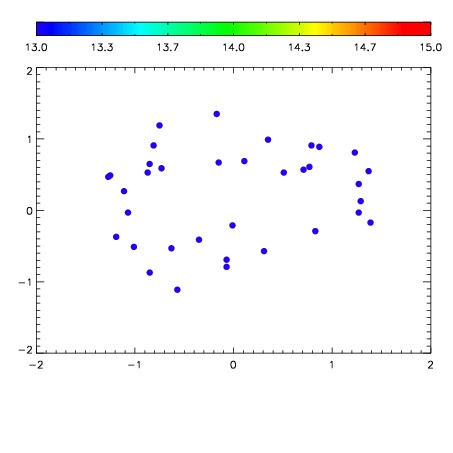

| Frame | Nreads | Zeropoints | Mag plots | Spatial mag deviation | Spatial sky 16325A emission deviations (filled: sky, open: star) | Spatial sky continuum emission | Spatial sky telluric CO2 absorption deviations (filled: H < 10) | |||||||||||||||||||||||
| 0 | 0 |
|
|
|
|
|
|
| IPAIR | NAME | SHIFT | NEWSHIFT | S/N | NAME | SHIFT | NEWSHIFT | S/N |
| 0 | 19410064 | 0.000121794 | 0.00000 | 19.0715 | 19410061 | -0.483520 | 0.483642 | 19.0409 |
| 1 | 19410063 | -0.000212130 | 0.000333924 | 19.0649 | 19410062 | -0.483755 | 0.483877 | 19.0382 |
| 2 | 19410060 | 0.00000 | 0.000121794 | 19.0340 | 19410065 | -0.485572 | 0.485694 | 19.0289 |