| Red | Green | Blue | |
| z | 17.64 | ||
| znorm | Inf | ||
| sky | -Inf | -Inf | -NaN |
| S/N | 32.7 | 51.6 | 58.4 |
| S/N(c) | 0.7 | 45.7 | 52.4 |
| SN(E/C) |
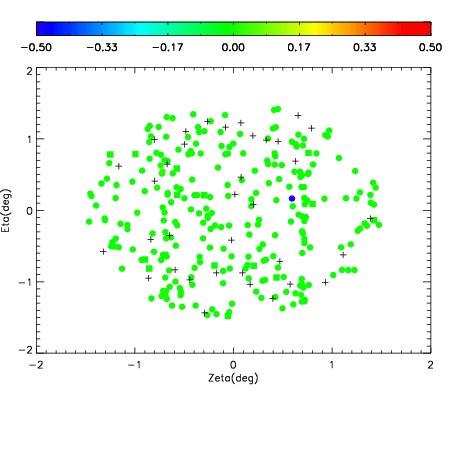
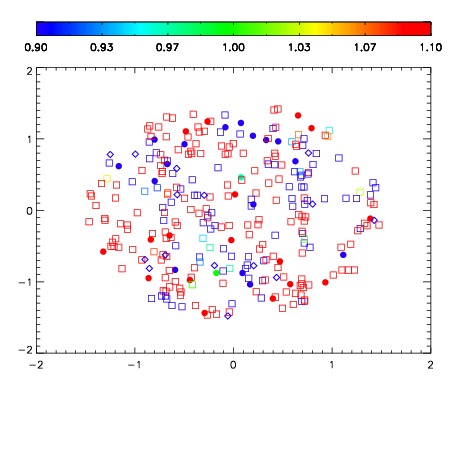


| Frame | Nreads | Zeropoints | Mag plots | Spatial mag deviation | Spatial sky 16325A emission deviations (filled: sky, open: star) | Spatial sky continuum emission | Spatial sky telluric CO2 absorption deviations (filled: H < 10) | |||||||||||||||||||||||
| 0 | 0 |
|
|
|
|
|
|
| IPAIR | NAME | SHIFT | NEWSHIFT | S/N | NAME | SHIFT | NEWSHIFT | S/N |
| 0 | 19400059 | 0.480133 | 0.00000 | 18.9525 | 19400057 | -0.00397327 | 0.484106 | 18.9080 |
| 1 | 19400055 | 0.479852 | 0.000281006 | 18.9364 | 19400058 | -0.00317709 | 0.483310 | 18.8859 |
| 2 | 19400056 | 0.480044 | 8.89897e-05 | 18.9302 | 19400054 | 0.00000 | 0.480133 | 18.8781 |
| 3 | 19400060 | 0.479996 | 0.000137001 | 18.9007 | 19400061 | -0.00462709 | 0.484760 | 18.8130 |