| Red | Green | Blue | |
| z | 17.64 | ||
| znorm | Inf | ||
| sky | -Inf | -Inf | -Inf |
| S/N | 20.7 | 34.5 | 40.8 |
| S/N(c) | 23.0 | 29.2 | 66.4 |
| SN(E/C) |
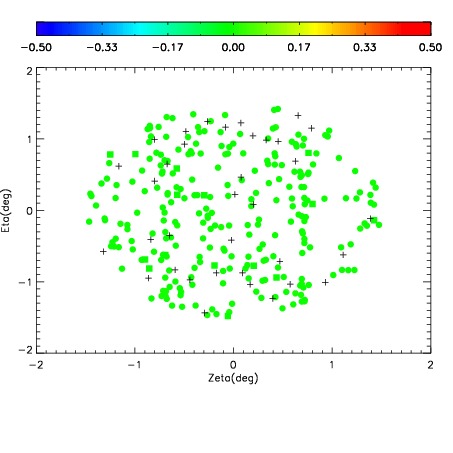
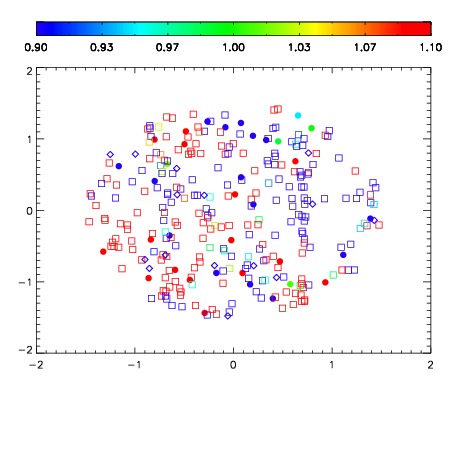


| Frame | Nreads | Zeropoints | Mag plots | Spatial mag deviation | Spatial sky 16325A emission deviations (filled: sky, open: star) | Spatial sky continuum emission | Spatial sky telluric CO2 absorption deviations (filled: H < 10) | |||||||||||||||||||||||
| 0 | 0 |
|
|
|
|
|
|
| IPAIR | NAME | SHIFT | NEWSHIFT | S/N | NAME | SHIFT | NEWSHIFT | S/N |
| 0 | 19600044 | 0.00000 | 0.00000 | 19.0124 | 19600045 | -0.494330 | 0.494330 | 18.9610 |
| 1 | 19600047 | -0.000130313 | 0.000130313 | 18.8949 | 19600046 | -0.494969 | 0.494969 | 18.9534 |