| Red | Green | Blue | |
| z | 17.64 | ||
| znorm | Inf | ||
| sky | -Inf | -NaN | -NaN |
| S/N | 30.7 | 48.2 | 56.1 |
| S/N(c) | 29.2 | 0.9 | 48.7 |
| SN(E/C) |
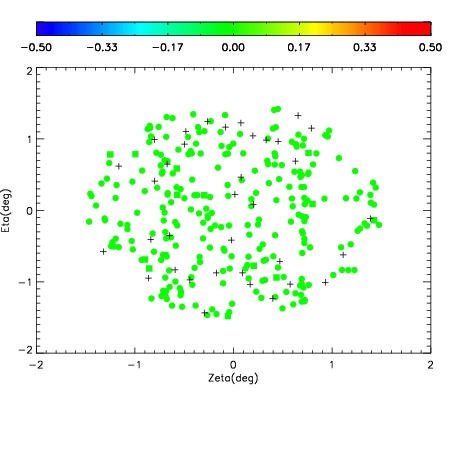
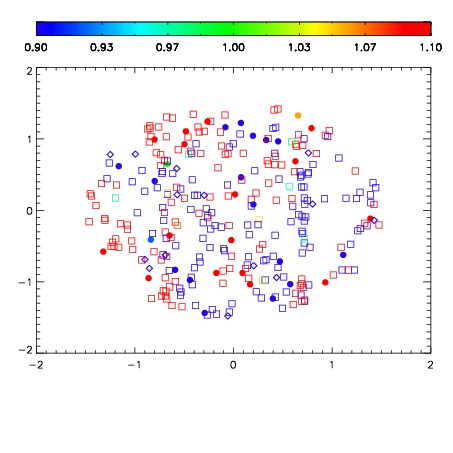
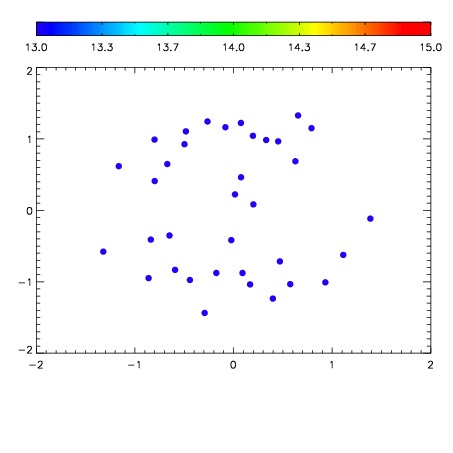

| Frame | Nreads | Zeropoints | Mag plots | Spatial mag deviation | Spatial sky 16325A emission deviations (filled: sky, open: star) | Spatial sky continuum emission | Spatial sky telluric CO2 absorption deviations (filled: H < 10) | |||||||||||||||||||||||
| 0 | 0 |
|
|
|
|
|
|
| IPAIR | NAME | SHIFT | NEWSHIFT | S/N | NAME | SHIFT | NEWSHIFT | S/N |
| 0 | 19680035 | 0.488482 | 0.00000 | 18.8207 | 19680040 | -0.00205104 | 0.490533 | 18.8000 |
| 1 | 19680038 | 0.482369 | 0.00611299 | 18.9450 | 19680036 | -0.000326736 | 0.488809 | 18.9981 |
| 2 | 19680039 | 0.482477 | 0.00600499 | 18.9434 | 19680037 | -0.000294266 | 0.488776 | 18.9128 |
| 3 | 19680034 | 0.488341 | 0.000140995 | 18.6358 | 19680033 | 0.00000 | 0.488482 | 18.5303 |