| Red | Green | Blue | |
| z | 17.64 | ||
| znorm | Inf | ||
| sky | -Inf | -Inf | -Inf |
| S/N | 35.6 | 56.9 | 66.9 |
| S/N(c) | 36.3 | 53.7 | 1.3 |
| SN(E/C) |
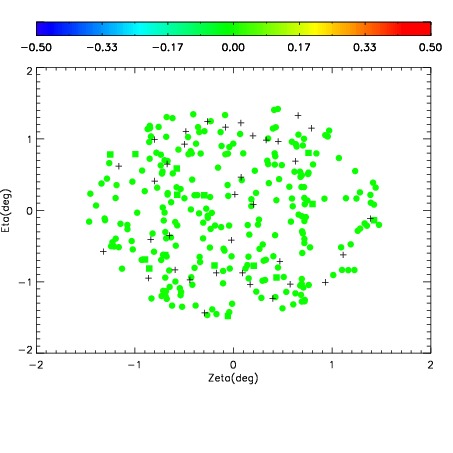
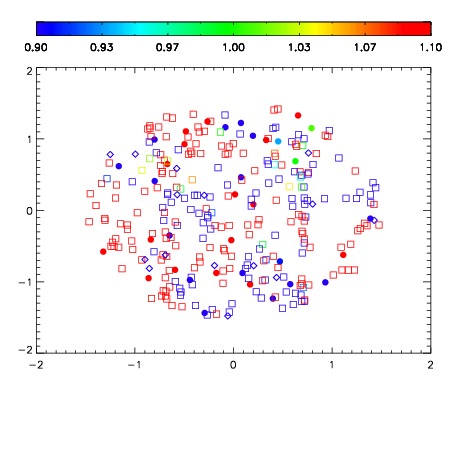


| Frame | Nreads | Zeropoints | Mag plots | Spatial mag deviation | Spatial sky 16325A emission deviations (filled: sky, open: star) | Spatial sky continuum emission | Spatial sky telluric CO2 absorption deviations (filled: H < 10) | |||||||||||||||||||||||
| 0 | 0 |
|
|
|
|
|
|
| IPAIR | NAME | SHIFT | NEWSHIFT | S/N | NAME | SHIFT | NEWSHIFT | S/N |
| 0 | 19710043 | 0.492872 | 0.00000 | 19.0916 | 19710044 | -0.00367911 | 0.496551 | 19.0786 |
| 1 | 19710039 | 0.491419 | 0.00145301 | 19.1018 | 19710040 | 0.00343143 | 0.489441 | 19.1163 |
| 2 | 19710042 | 0.492062 | 0.000809997 | 19.1002 | 19710041 | 0.00268233 | 0.490190 | 19.1149 |
| 3 | 19710038 | 0.489882 | 0.00299001 | 19.0660 | 19710037 | 0.00000 | 0.492872 | 19.0746 |