| Red | Green | Blue | |
| z | 17.64 | ||
| znorm | Inf | ||
| sky | -Inf | -Inf | -Inf |
| S/N | 32.1 | 47.9 | 60.9 |
| S/N(c) | 33.2 | 48.0 | 49.7 |
| SN(E/C) |

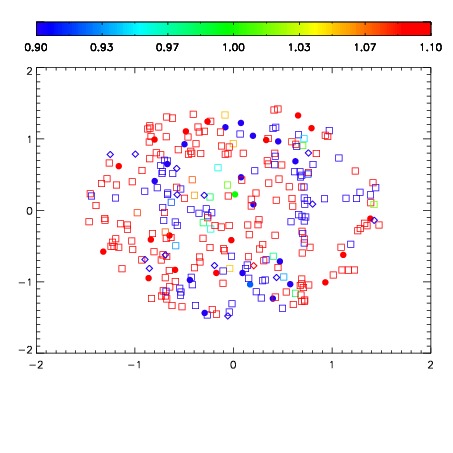


| Frame | Nreads | Zeropoints | Mag plots | Spatial mag deviation | Spatial sky 16325A emission deviations (filled: sky, open: star) | Spatial sky continuum emission | Spatial sky telluric CO2 absorption deviations (filled: H < 10) | |||||||||||||||||||||||
| 0 | 0 |
|
|
|
|
|
|
| IPAIR | NAME | SHIFT | NEWSHIFT | S/N | NAME | SHIFT | NEWSHIFT | S/N |
| 0 | 19740046 | 0.000755533 | 0.00000 | 19.0433 | 19740043 | -0.496391 | 0.497147 | 19.0653 |
| 1 | 19740045 | 0.000598110 | 0.000157423 | 19.0671 | 19740044 | -0.496619 | 0.497375 | 19.0912 |
| 2 | 19740042 | 0.00000 | 0.000755533 | 19.0336 | 19740047 | -0.498346 | 0.499102 | 19.0248 |
| 3 | 19740049 | -0.000765184 | 0.00152072 | 18.9982 | 19740048 | -0.498630 | 0.499386 | 18.9866 |