| Red | Green | Blue | |
| z | 17.65 | ||
| znorm | Inf | ||
| sky | -Inf | -Inf | -Inf |
| S/N | 24.1 | 34.7 | 44.5 |
| S/N(c) | 24.7 | 59.4 | 41.2 |
| SN(E/C) |


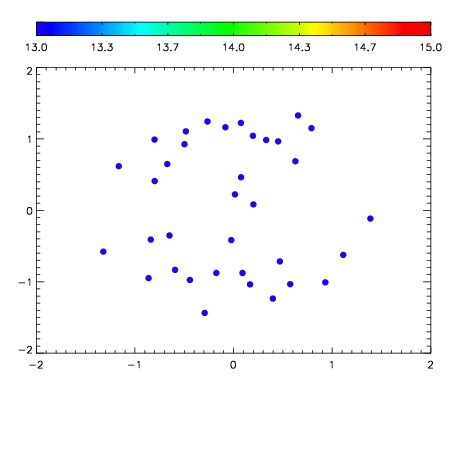

| Frame | Nreads | Zeropoints | Mag plots | Spatial mag deviation | Spatial sky 16325A emission deviations (filled: sky, open: star) | Spatial sky continuum emission | Spatial sky telluric CO2 absorption deviations (filled: H < 10) | |||||||||||||||||||||||
| 0 | 0 |
|
|
|
|
|
|
| IPAIR | NAME | SHIFT | NEWSHIFT | S/N | NAME | SHIFT | NEWSHIFT | S/N |
| 0 | 19930013 | 0.495314 | 0.00000 | 18.9207 | 19930014 | -0.00374720 | 0.499061 | 18.8504 |
| 1 | 19930012 | 0.494005 | 0.00130901 | 18.9371 | 19930011 | 0.00000 | 0.495314 | 18.9199 |