| Red | Green | Blue | |
| z | 17.62 | ||
| znorm | Inf | ||
| sky | -NaN | -NaN | -NaN |
| S/N | 35.5 | 54.0 | 63.4 |
| S/N(c) | 22.5 | 92.3 | 21.1 |
| SN(E/C) |
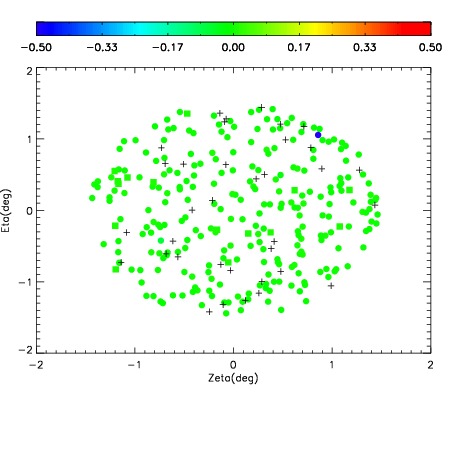
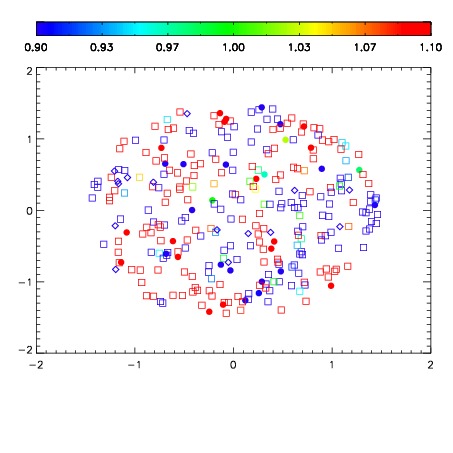
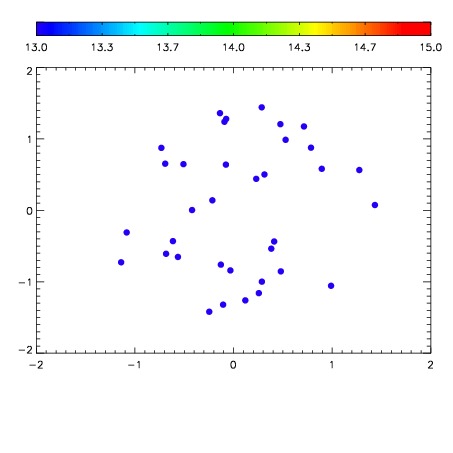

| Frame | Nreads | Zeropoints | Mag plots | Spatial mag deviation | Spatial sky 16325A emission deviations (filled: sky, open: star) | Spatial sky continuum emission | Spatial sky telluric CO2 absorption deviations (filled: H < 10) | |||||||||||||||||||||||
| 0 | 0 |
|
|
|
|
|
|
| IPAIR | NAME | SHIFT | NEWSHIFT | S/N | NAME | SHIFT | NEWSHIFT | S/N |
| 0 | 19350024 | 0.491855 | 0.00000 | 18.9720 | 19350025 | 0.00302418 | 0.488831 | 18.8992 |
| 1 | 19350020 | 0.490786 | 0.00106901 | 18.9975 | 19350018 | 0.00000 | 0.491855 | 18.9660 |
| 2 | 19350019 | 0.490944 | 0.000910997 | 18.9962 | 19350021 | 0.000537519 | 0.491317 | 18.9550 |
| 3 | 19350023 | 0.491167 | 0.000687987 | 18.9771 | 19350022 | 0.000149023 | 0.491706 | 18.9508 |