| Red | Green | Blue | |
| z | 17.63 | ||
| znorm | Inf | ||
| sky | -NaN | -NaN | -NaN |
| S/N | 24.7 | 39.3 | 44.7 |
| S/N(c) | 17.9 | 74.0 | 139.6 |
| SN(E/C) |
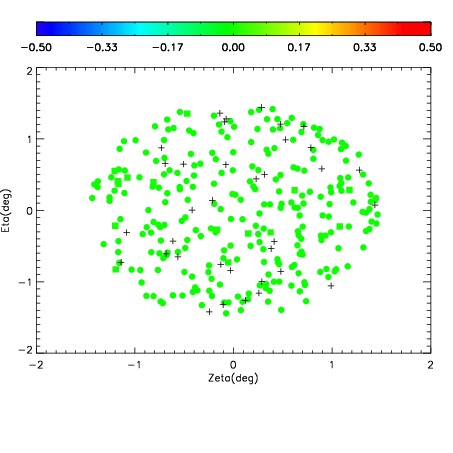
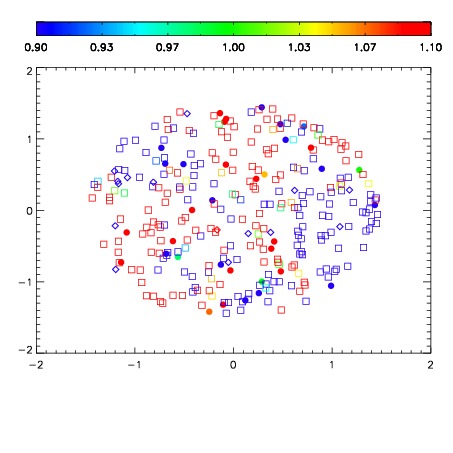
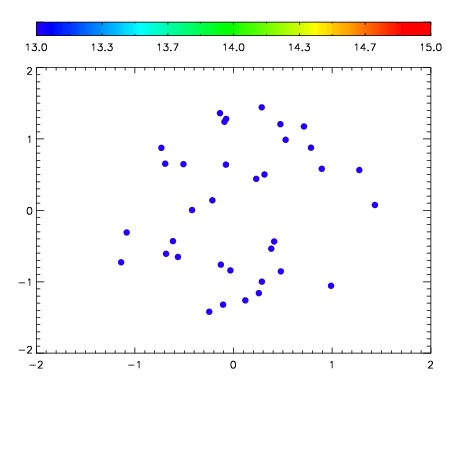

| Frame | Nreads | Zeropoints | Mag plots | Spatial mag deviation | Spatial sky 16325A emission deviations (filled: sky, open: star) | Spatial sky continuum emission | Spatial sky telluric CO2 absorption deviations (filled: H < 10) | |||||||||||||||||||||||
| 0 | 0 |
|
|
|
|
|
|
| IPAIR | NAME | SHIFT | NEWSHIFT | S/N | NAME | SHIFT | NEWSHIFT | S/N |
| 0 | 19380035 | 0.494028 | 0.00000 | 18.5438 | 19380033 | -0.00157505 | 0.495603 | 18.4150 |
| 1 | 19380034 | 0.493663 | 0.000364989 | 18.5510 | 19380036 | -0.000675983 | 0.494704 | 18.5011 |
| 2 | 19380031 | 0.492775 | 0.00125301 | 18.1763 | 19380032 | -0.000529227 | 0.494557 | 18.3597 |
| 3 | 19380030 | 0.491892 | 0.00213599 | 18.1648 | 19380029 | 0.00000 | 0.494028 | 18.1598 |