| Red | Green | Blue | |
| z | 17.63 | ||
| znorm | Inf | ||
| sky | -NaN | -NaN | -NaN |
| S/N | 30.3 | 47.8 | 56.4 |
| S/N(c) | 13.2 | 0.7 | 22.0 |
| SN(E/C) |
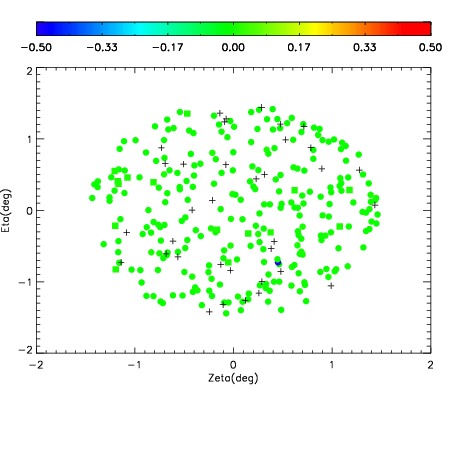
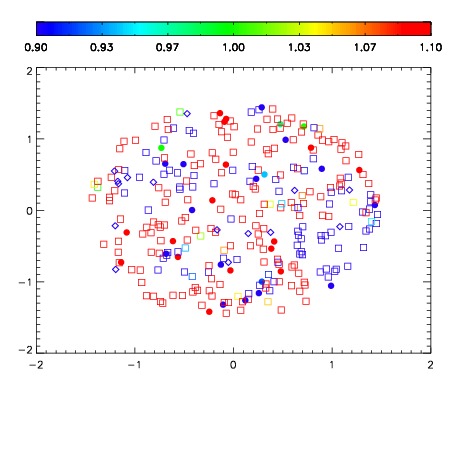
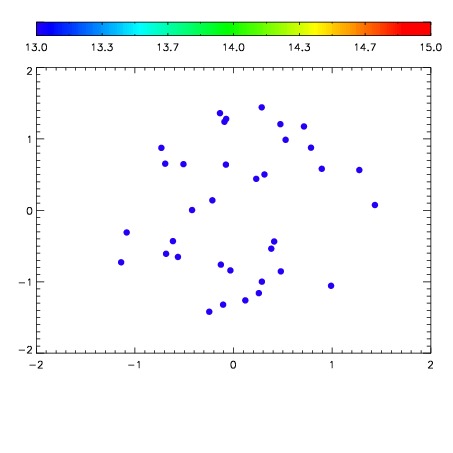

| Frame | Nreads | Zeropoints | Mag plots | Spatial mag deviation | Spatial sky 16325A emission deviations (filled: sky, open: star) | Spatial sky continuum emission | Spatial sky telluric CO2 absorption deviations (filled: H < 10) | |||||||||||||||||||||||
| 0 | 0 |
|
|
|
|
|
|
| IPAIR | NAME | SHIFT | NEWSHIFT | S/N | NAME | SHIFT | NEWSHIFT | S/N |
| 0 | 19410028 | 0.000777640 | 0.00000 | 18.8704 | 19410029 | -0.487783 | 0.488561 | 18.8874 |
| 1 | 19410031 | -0.00141995 | 0.00219759 | 18.9320 | 19410030 | -0.489016 | 0.489794 | 18.9059 |
| 2 | 19410024 | 0.00000 | 0.000777640 | 18.8240 | 19410026 | -0.485949 | 0.486727 | 18.8381 |
| 3 | 19410027 | 6.26321e-05 | 0.000715008 | 18.8163 | 19410025 | -0.486162 | 0.486940 | 18.7772 |