| Red | Green | Blue | |
| z | 17.62 | ||
| znorm | Inf | ||
| sky | -NaN | -NaN | -NaN |
| S/N | 34.1 | 50.8 | 59.3 |
| S/N(c) | 23.2 | 148.1 | 42.0 |
| SN(E/C) |
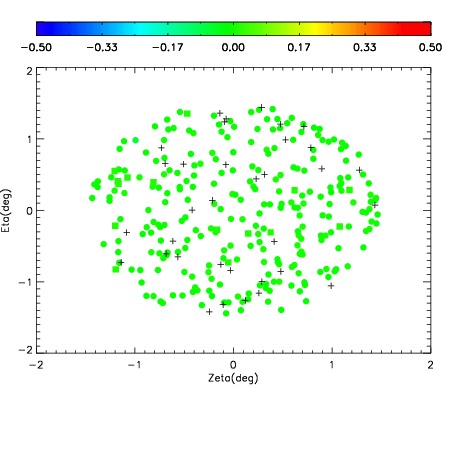
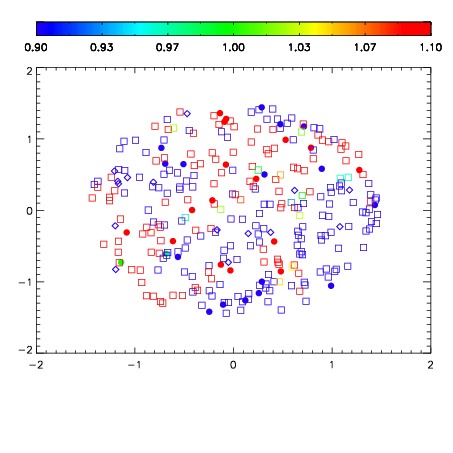
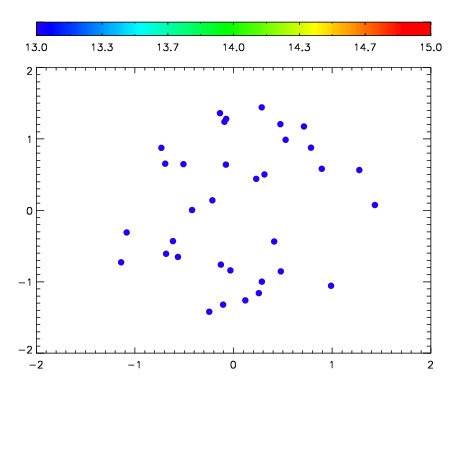

| Frame | Nreads | Zeropoints | Mag plots | Spatial mag deviation | Spatial sky 16325A emission deviations (filled: sky, open: star) | Spatial sky continuum emission | Spatial sky telluric CO2 absorption deviations (filled: H < 10) | |||||||||||||||||||||||
| 0 | 0 |
|
|
|
|
|
|
| IPAIR | NAME | SHIFT | NEWSHIFT | S/N | NAME | SHIFT | NEWSHIFT | S/N |
| 0 | 19600012 | 0.497918 | 0.00000 | 18.9403 | 19600017 | -0.000877588 | 0.498796 | 18.8724 |
| 1 | 19600015 | 0.493797 | 0.00412101 | 19.0095 | 19600014 | -0.00243945 | 0.500357 | 18.9739 |
| 2 | 19600016 | 0.494684 | 0.00323400 | 18.9988 | 19600013 | -0.00269891 | 0.500617 | 18.9369 |
| 3 | 19600011 | 0.497198 | 0.000720024 | 18.9220 | 19600010 | 0.00000 | 0.497918 | 18.8351 |