| Red | Green | Blue | |
| z | 17.62 | ||
| znorm | Inf | ||
| sky | -NaN | -NaN | -NaN |
| S/N | 26.3 | 38.5 | 46.5 |
| S/N(c) | 16.2 | 21.0 | 33.3 |
| SN(E/C) |
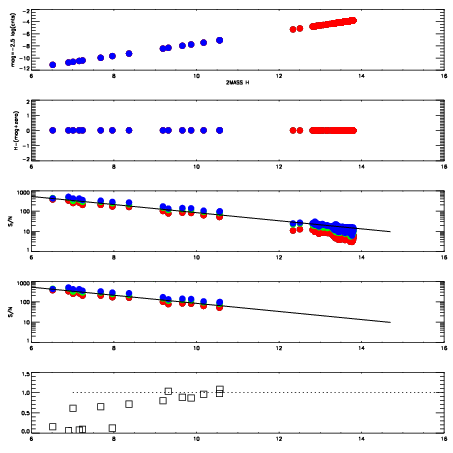
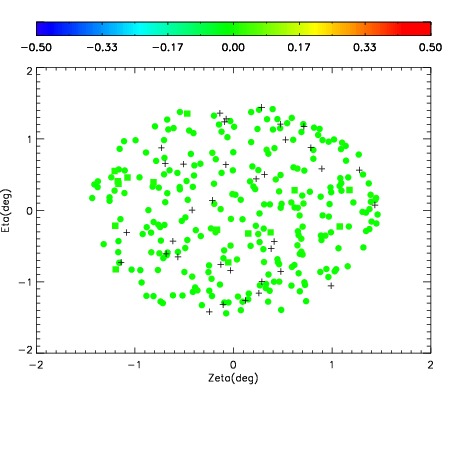
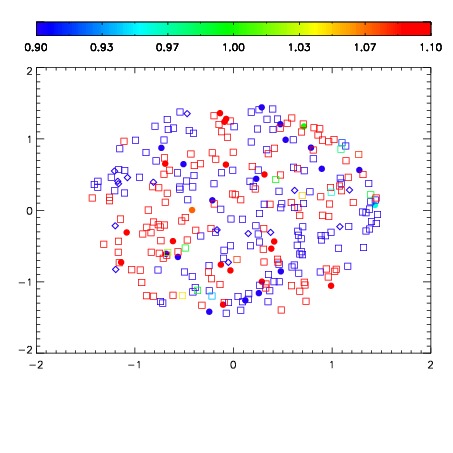
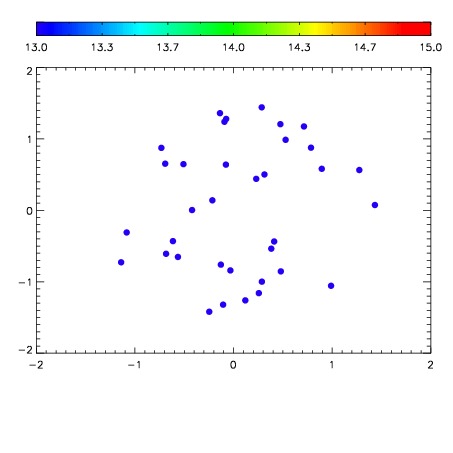

| Frame | Nreads | Zeropoints | Mag plots | Spatial mag deviation | Spatial sky 16325A emission deviations (filled: sky, open: star) | Spatial sky continuum emission | Spatial sky telluric CO2 absorption deviations (filled: H < 10) | |||||||||||||||||||||||
| 0 | 0 |
|
|
|
|
|
|
| IPAIR | NAME | SHIFT | NEWSHIFT | S/N | NAME | SHIFT | NEWSHIFT | S/N |
| 0 | 19670013 | 0.500226 | 0.00000 | 18.9987 | 19670014 | 0.000739119 | 0.499487 | 19.0205 |
| 1 | 19670012 | 0.499232 | 0.000994027 | 18.9704 | 19670011 | 0.00000 | 0.500226 | 18.9842 |