| Red | Green | Blue | |
| z | 17.66 | ||
| znorm | Inf | ||
| sky | -Inf | -Inf | -Inf |
| S/N | 6.4 | 12.3 | 14.0 |
| S/N(c) | 7.9 | 0.1 | 22.5 |
| SN(E/C) |
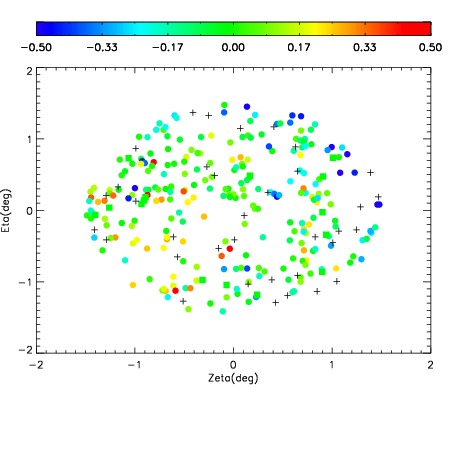
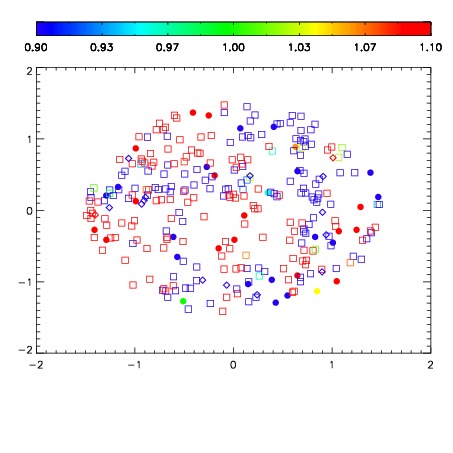
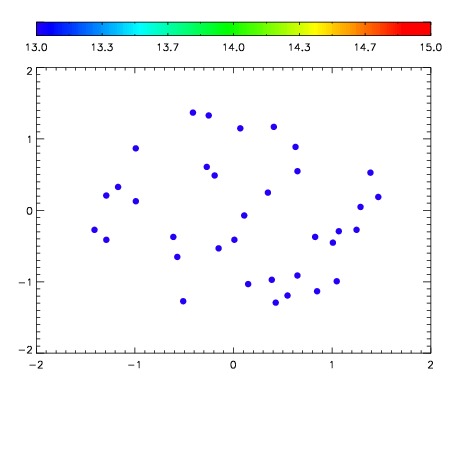

| Frame | Nreads | Zeropoints | Mag plots | Spatial mag deviation | Spatial sky 16325A emission deviations (filled: sky, open: star) | Spatial sky continuum emission | Spatial sky telluric CO2 absorption deviations (filled: H < 10) | |||||||||||||||||||||||
| 0 | 0 |
|
|
|
|
|
|
| IPAIR | NAME | SHIFT | NEWSHIFT | S/N | NAME | SHIFT | NEWSHIFT | S/N |
| 0 | 19310035 | 0.493552 | 0.00000 | 17.0431 | 19310033 | 0.00000 | 0.493552 | 17.8815 |
| 1 | 19310034 | 0.493347 | 0.000205010 | 16.7282 | 19310037 | 0.00248004 | 0.491072 | 15.1815 |
| 2 | 19310039 | 0.491113 | 0.00243899 | 14.7921 | 19310036 | 0.00207325 | 0.491479 | 15.0335 |