| Red | Green | Blue | |
| z | 17.64 | ||
| znorm | Inf | ||
| sky | -Inf | -Inf | -NaN |
| S/N | 34.1 | 55.0 | 64.6 |
| S/N(c) | 31.7 | 0.5 | 82.2 |
| SN(E/C) |
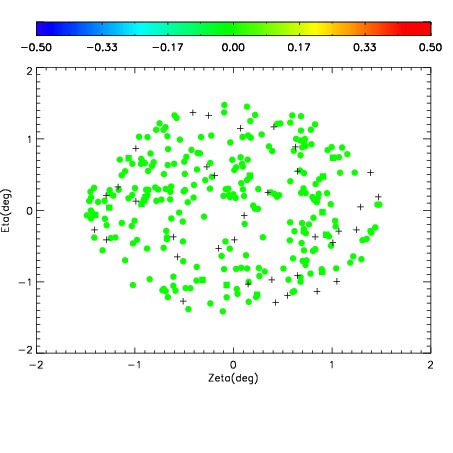
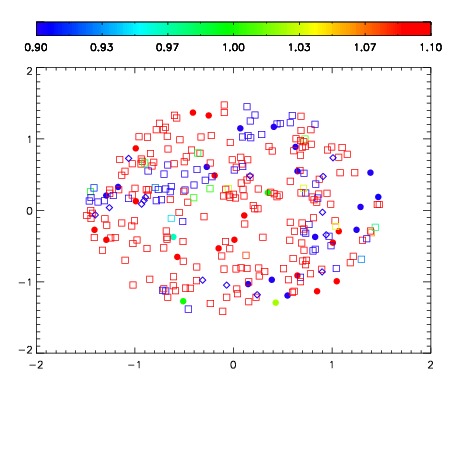
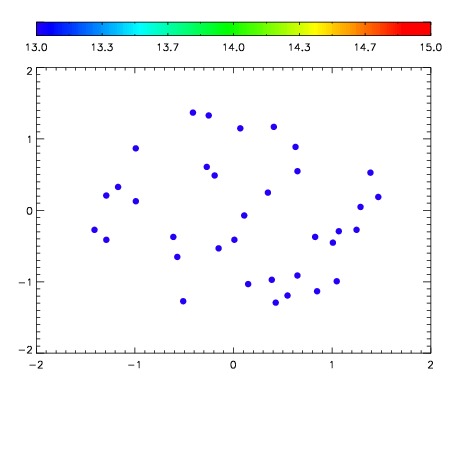

| Frame | Nreads | Zeropoints | Mag plots | Spatial mag deviation | Spatial sky 16325A emission deviations (filled: sky, open: star) | Spatial sky continuum emission | Spatial sky telluric CO2 absorption deviations (filled: H < 10) | |||||||||||||||||||||||
| 0 | 0 |
|
|
|
|
|
|
| IPAIR | NAME | SHIFT | NEWSHIFT | S/N | NAME | SHIFT | NEWSHIFT | S/N |
| 0 | 19410038 | 0.000375773 | 0.00000 | 18.9668 | 19410037 | -0.485374 | 0.485750 | 18.9868 |
| 1 | 19410035 | 0.00000 | 0.000375773 | 19.0140 | 19410036 | -0.485540 | 0.485916 | 18.9930 |
| 2 | 19410039 | 9.13602e-05 | 0.000284413 | 18.9316 | 19410041 | -0.485948 | 0.486324 | 18.9725 |
| 3 | 19410042 | -0.000817815 | 0.00119359 | 18.9210 | 19410040 | -0.485729 | 0.486105 | 18.9332 |