| Red | Green | Blue | |
| z | 17.64 | ||
| znorm | Inf | ||
| sky | -Inf | -Inf | -Inf |
| S/N | 28.6 | 45.2 | 52.9 |
| S/N(c) | 36.0 | 84.8 | 87.0 |
| SN(E/C) |
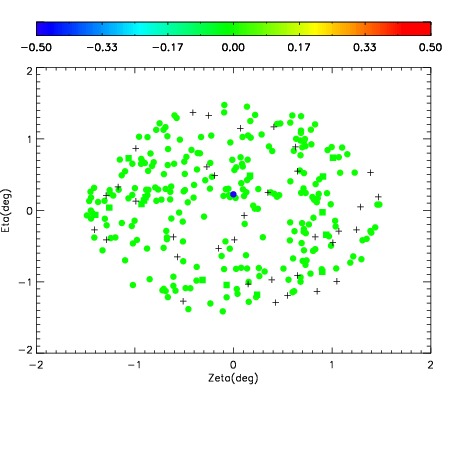
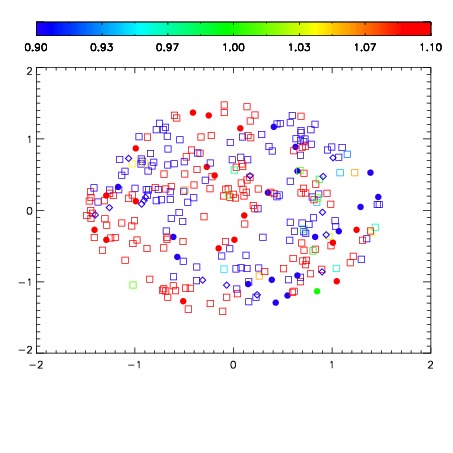
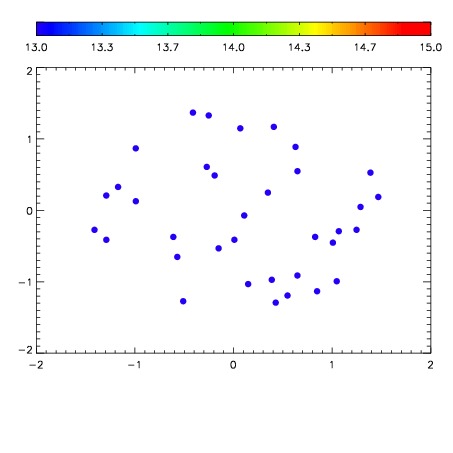

| Frame | Nreads | Zeropoints | Mag plots | Spatial mag deviation | Spatial sky 16325A emission deviations (filled: sky, open: star) | Spatial sky continuum emission | Spatial sky telluric CO2 absorption deviations (filled: H < 10) | |||||||||||||||||||||||
| 0 | 0 |
|
|
|
|
|
|
| IPAIR | NAME | SHIFT | NEWSHIFT | S/N | NAME | SHIFT | NEWSHIFT | S/N |
| 0 | 19590024 | 0.497301 | 0.00000 | 18.4876 | 19590025 | 0.00120255 | 0.496098 | 18.3714 |
| 1 | 19590027 | 0.495960 | 0.00134102 | 18.7068 | 19590029 | -0.000719160 | 0.498020 | 18.6274 |
| 2 | 19590028 | 0.496580 | 0.000721008 | 18.6123 | 19590022 | 0.00000 | 0.497301 | 18.6170 |
| 3 | 19590023 | 0.497061 | 0.000239998 | 18.5906 | 19590026 | 0.000595994 | 0.496705 | 18.5330 |