| Red | Green | Blue | |
| z | 17.65 | ||
| znorm | Inf | ||
| sky | -Inf | -Inf | -NaN |
| S/N | 25.2 | 39.2 | 46.4 |
| S/N(c) | 23.6 | 61.8 | 62.7 |
| SN(E/C) |
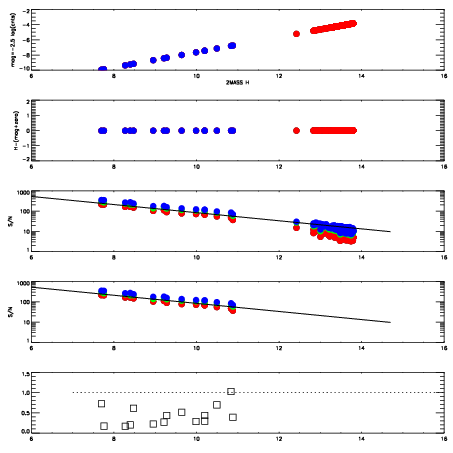
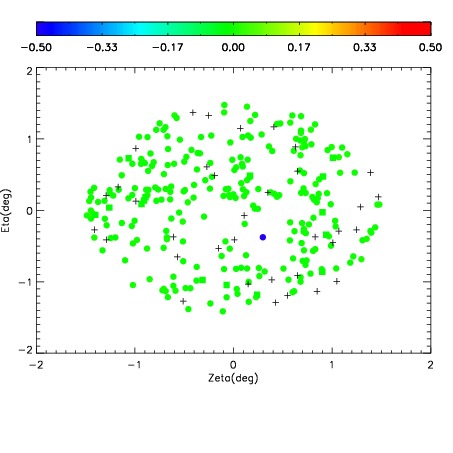
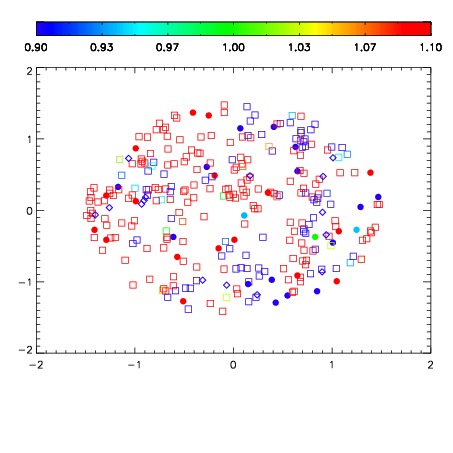
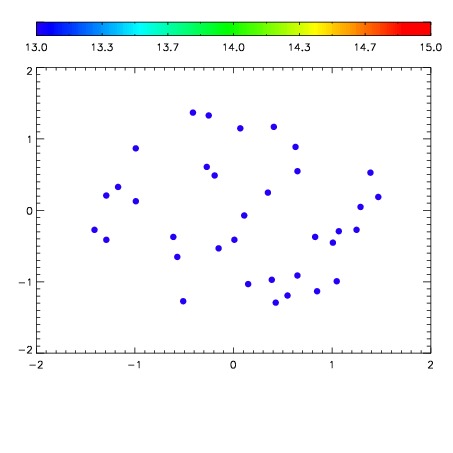

| Frame | Nreads | Zeropoints | Mag plots | Spatial mag deviation | Spatial sky 16325A emission deviations (filled: sky, open: star) | Spatial sky continuum emission | Spatial sky telluric CO2 absorption deviations (filled: H < 10) | |||||||||||||||||||||||
| 0 | 0 |
|
|
|
|
|
|
| IPAIR | NAME | SHIFT | NEWSHIFT | S/N | NAME | SHIFT | NEWSHIFT | S/N |
| 0 | 19670020 | 0.499931 | 0.00000 | 19.0677 | 19670021 | 0.000848622 | 0.499082 | 19.0230 |
| 1 | 19670019 | 0.499511 | 0.000420004 | 19.0743 | 19670018 | 0.00000 | 0.499931 | 19.0717 |