| Red | Green | Blue | |
| z | 17.64 | ||
| znorm | Inf | ||
| sky | -Inf | -Inf | -Inf |
| S/N | 29.8 | 47.4 | 55.6 |
| S/N(c) | 36.7 | 74.7 | 0.8 |
| SN(E/C) |
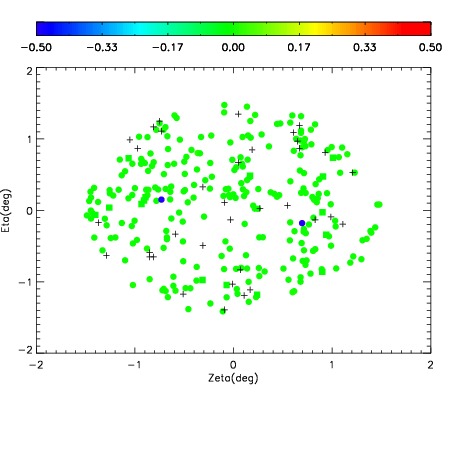
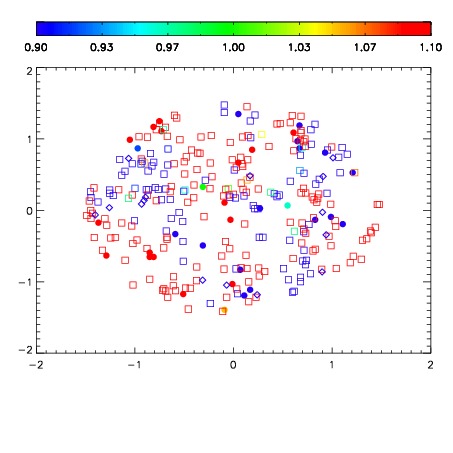
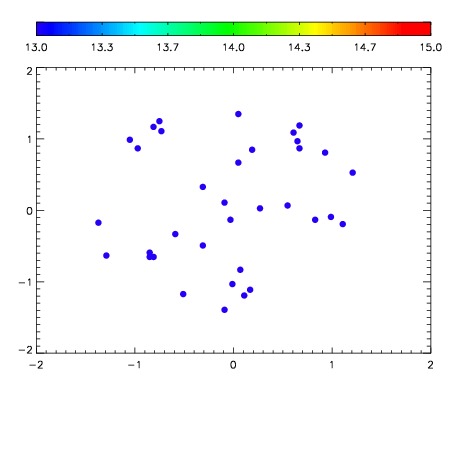

| Frame | Nreads | Zeropoints | Mag plots | Spatial mag deviation | Spatial sky 16325A emission deviations (filled: sky, open: star) | Spatial sky continuum emission | Spatial sky telluric CO2 absorption deviations (filled: H < 10) | |||||||||||||||||||||||
| 0 | 0 |
|
|
|
|
|
|
| IPAIR | NAME | SHIFT | NEWSHIFT | S/N | NAME | SHIFT | NEWSHIFT | S/N |
| 0 | 19400038 | 0.488126 | 0.00000 | 18.6925 | 19400040 | 0.00246115 | 0.485665 | 18.5697 |
| 1 | 19400041 | 0.487330 | 0.000796020 | 18.7565 | 19400036 | 0.00000 | 0.488126 | 18.7461 |
| 2 | 19400037 | 0.487461 | 0.000665009 | 18.7433 | 19400039 | 0.00297779 | 0.485148 | 18.7392 |
| 3 | 19400042 | 0.487307 | 0.000818998 | 18.7381 | 19400043 | 0.00401175 | 0.484114 | 18.6685 |