| Red | Green | Blue | |
| z | 17.64 | ||
| znorm | Inf | ||
| sky | -Inf | -Inf | -Inf |
| S/N | 34.7 | 55.1 | 64.0 |
| S/N(c) | 30.3 | 0.5 | 79.6 |
| SN(E/C) |
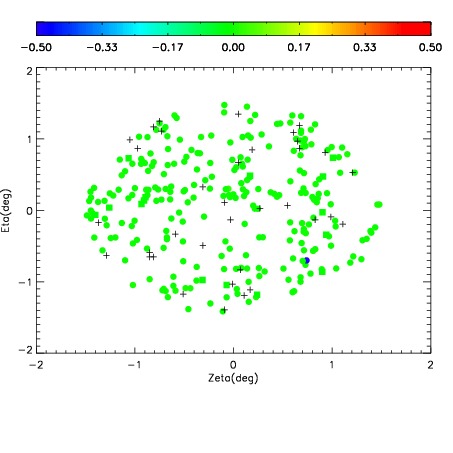
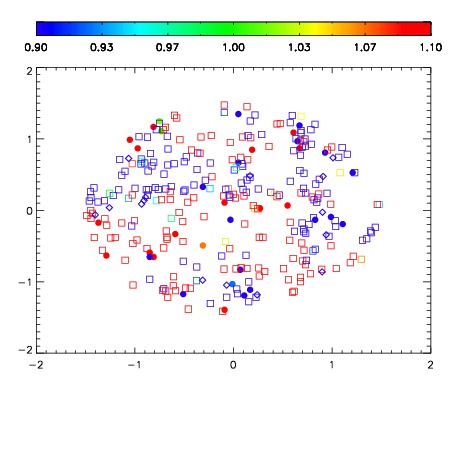
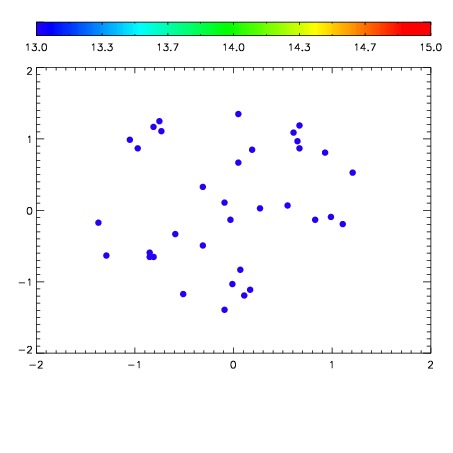

| Frame | Nreads | Zeropoints | Mag plots | Spatial mag deviation | Spatial sky 16325A emission deviations (filled: sky, open: star) | Spatial sky continuum emission | Spatial sky telluric CO2 absorption deviations (filled: H < 10) | |||||||||||||||||||||||
| 0 | 0 |
|
|
|
|
|
|
| IPAIR | NAME | SHIFT | NEWSHIFT | S/N | NAME | SHIFT | NEWSHIFT | S/N |
| 0 | 19600027 | 0.496457 | 0.00000 | 18.7662 | 19600024 | -0.000439145 | 0.496896 | 18.7984 |
| 1 | 19600022 | 0.496040 | 0.000417024 | 19.0065 | 19600021 | 0.00000 | 0.496457 | 18.9800 |
| 2 | 19600026 | 0.496194 | 0.000263005 | 18.9274 | 19600028 | -0.000867321 | 0.497324 | 18.9381 |
| 3 | 19600023 | 0.495964 | 0.000493020 | 18.9162 | 19600025 | -0.00136693 | 0.497824 | 18.8873 |