| Red | Green | Blue | |
| z | 17.65 | ||
| znorm | Inf | ||
| sky | -Inf | -Inf | -NaN |
| S/N | 22.3 | 37.0 | 43.7 |
| S/N(c) | 50.8 | 56.3 | 50.2 |
| SN(E/C) |
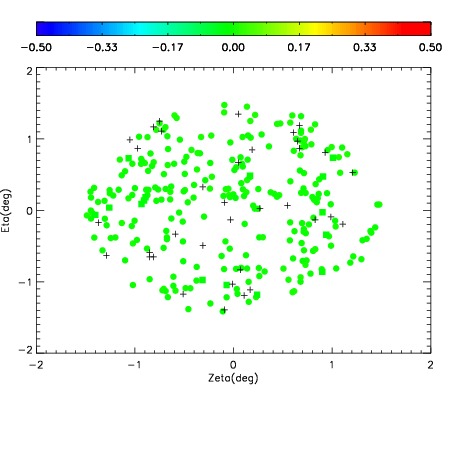
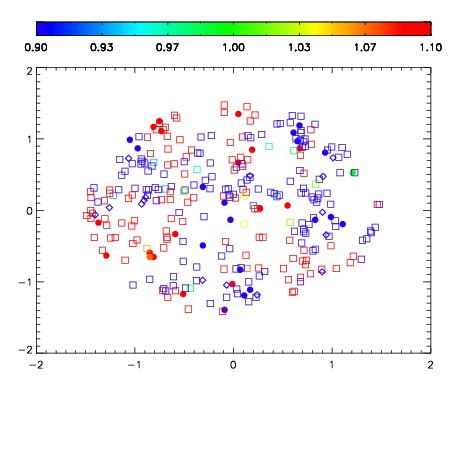
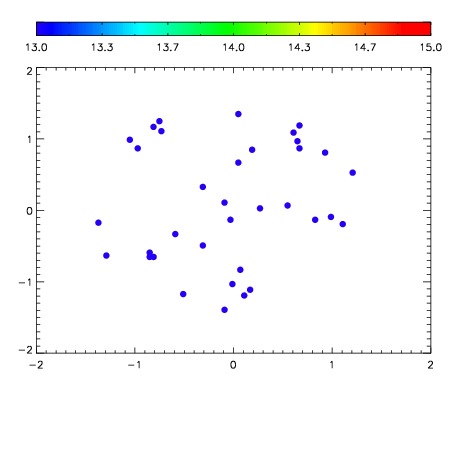

| Frame | Nreads | Zeropoints | Mag plots | Spatial mag deviation | Spatial sky 16325A emission deviations (filled: sky, open: star) | Spatial sky continuum emission | Spatial sky telluric CO2 absorption deviations (filled: H < 10) | |||||||||||||||||||||||
| 0 | 0 |
|
|
|
|
|
|
| IPAIR | NAME | SHIFT | NEWSHIFT | S/N | NAME | SHIFT | NEWSHIFT | S/N |
| 0 | 19680012 | 0.491181 | 0.00000 | 18.7409 | 19680018 | 0.00116695 | 0.490014 | 18.9676 |
| 1 | 19680013 | 0.491130 | 5.09918e-05 | 18.4991 | 19680014 | -0.00399382 | 0.495175 | 18.7778 |
| 2 | 19680017 | 0.490539 | 0.000641972 | 18.3243 | 19680011 | 0.00000 | 0.491181 | 16.3323 |
| 3 | 19680016 | 0.490682 | 0.000498980 | 16.0421 | 19680015 | -0.00247991 | 0.493661 | 15.7400 |