| Red | Green | Blue | |
| z | 17.64 | ||
| znorm | Inf | ||
| sky | -Inf | -Inf | -Inf |
| S/N | 25.7 | 49.3 | 53.9 |
| S/N(c) | 0.0 | 0.0 | 0.0 |
| SN(E/C) |
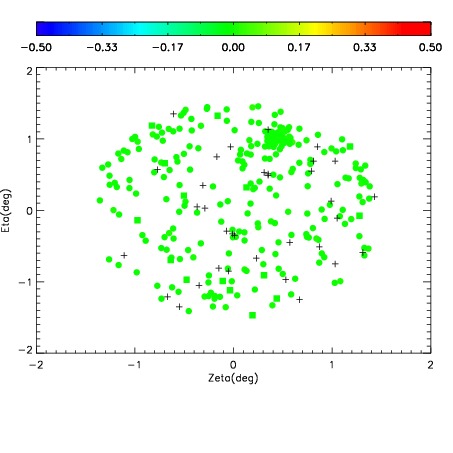
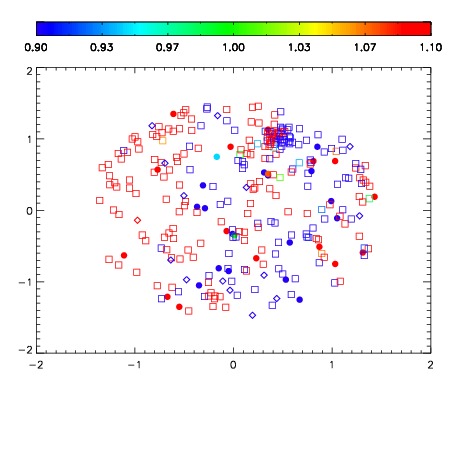
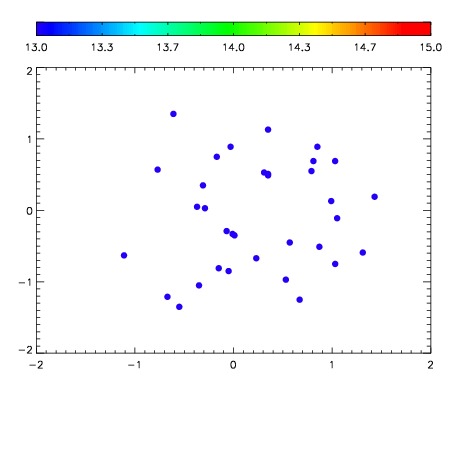

| Frame | Nreads | Zeropoints | Mag plots | Spatial mag deviation | Spatial sky 16325A emission deviations (filled: sky, open: star) | Spatial sky continuum emission | Spatial sky telluric CO2 absorption deviations (filled: H < 10) | |||||||||||||||||||||||
| 0 | 0 |
|
|
|
|
|
|
| IPAIR | NAME | SHIFT | NEWSHIFT | S/N | NAME | SHIFT | NEWSHIFT | S/N |
| 0 | 19330051 | 0.000719654 | 0.00000 | 18.3222 | 19330048 | -0.491465 | 0.492185 | 18.4040 |
| 1 | 19330055 | -0.00131217 | 0.00203182 | 18.9639 | 19330056 | -0.491286 | 0.492006 | 18.9763 |
| 2 | 19330058 | 3.99207e-05 | 0.000679733 | 18.9457 | 19330057 | -0.491105 | 0.491825 | 18.9698 |
| 3 | 19330054 | -0.00120227 | 0.00192192 | 18.8818 | 19330053 | -0.491308 | 0.492028 | 18.7052 |
| 4 | 19330047 | 0.00000 | 0.000719654 | 18.6530 | 19330052 | -0.490669 | 0.491389 | 18.5820 |
| 5 | 19330050 | 0.000714725 | 4.92902e-06 | 18.1017 | 19330049 | -0.491186 | 0.491906 | 18.2589 |