| Red | Green | Blue | |
| z | 17.64 | ||
| znorm | Inf | ||
| sky | -Inf | -Inf | -Inf |
| S/N | 18.6 | 35.6 | 36.7 |
| S/N(c) | 0.0 | 0.0 | 0.0 |
| SN(E/C) |
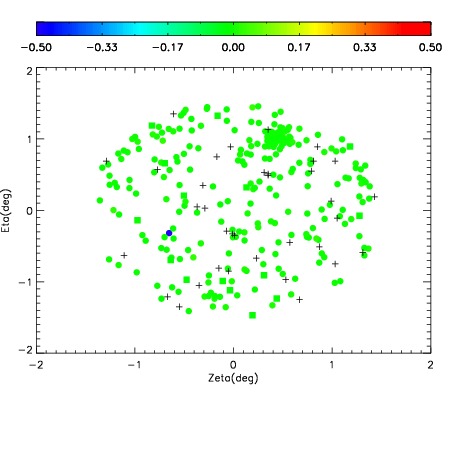
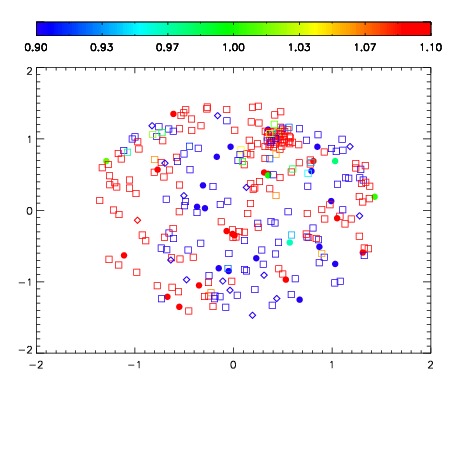
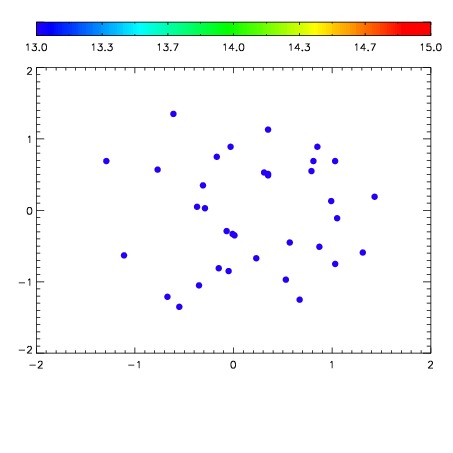

| Frame | Nreads | Zeropoints | Mag plots | Spatial mag deviation | Spatial sky 16325A emission deviations (filled: sky, open: star) | Spatial sky continuum emission | Spatial sky telluric CO2 absorption deviations (filled: H < 10) | |||||||||||||||||||||||
| 0 | 0 |
|
|
|
|
|
|
| IPAIR | NAME | SHIFT | NEWSHIFT | S/N | NAME | SHIFT | NEWSHIFT | S/N |
| 0 | 19590035 | 0.497284 | 0.00000 | 18.4336 | 19590033 | 0.00000 | 0.497284 | 18.3096 |
| 1 | 19590038 | 0.495836 | 0.00144801 | 18.6568 | 19590040 | -0.000995899 | 0.498280 | 18.7750 |
| 2 | 19590039 | 0.496167 | 0.00111699 | 18.6560 | 19590037 | -0.000259274 | 0.497543 | 18.4323 |
| 3 | 19590034 | 0.496990 | 0.000294000 | 18.2839 | 19590036 | 0.000186632 | 0.497097 | 18.2870 |