| Red | Green | Blue | |
| z | 17.64 | ||
| znorm | Inf | ||
| sky | -Inf | -NaN | -NaN |
| S/N | 25.4 | 38.2 | 48.0 |
| S/N(c) | 26.2 | 37.1 | 37.2 |
| SN(E/C) |

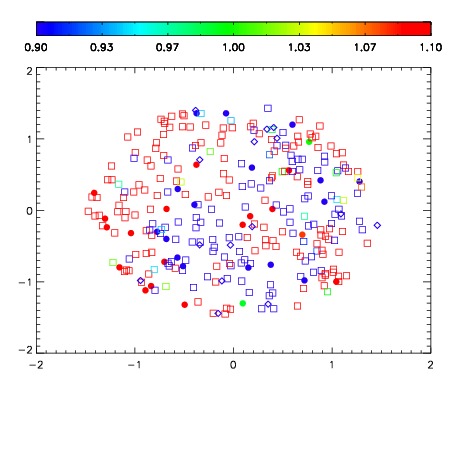
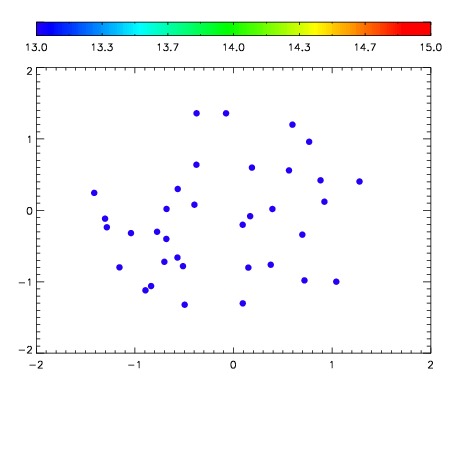

| Frame | Nreads | Zeropoints | Mag plots | Spatial mag deviation | Spatial sky 16325A emission deviations (filled: sky, open: star) | Spatial sky continuum emission | Spatial sky telluric CO2 absorption deviations (filled: H < 10) | |||||||||||||||||||||||
| 0 | 0 |
|
|
|
|
|
|
| IPAIR | NAME | SHIFT | NEWSHIFT | S/N | NAME | SHIFT | NEWSHIFT | S/N |
| 0 | 19380020 | 0.490305 | 0.00000 | 18.6689 | 19380018 | 0.00000 | 0.490305 | 18.6105 |
| 1 | 19380019 | 0.489698 | 0.000607014 | 18.6487 | 19380021 | -0.00270088 | 0.493006 | 18.5275 |
| 2 | 19380023 | 0.489061 | 0.00124401 | 18.3710 | 19380025 | -0.00293259 | 0.493238 | 18.4035 |
| 3 | 19380024 | 0.488737 | 0.00156802 | 18.3019 | 19380022 | -0.00302304 | 0.493328 | 18.3847 |