| Red | Green | Blue | |
| z | 17.64 | ||
| znorm | Inf | ||
| sky | -Inf | -Inf | -NaN |
| S/N | 27.3 | 40.1 | 50.9 |
| S/N(c) | 20.8 | 38.6 | 43.6 |
| SN(E/C) |
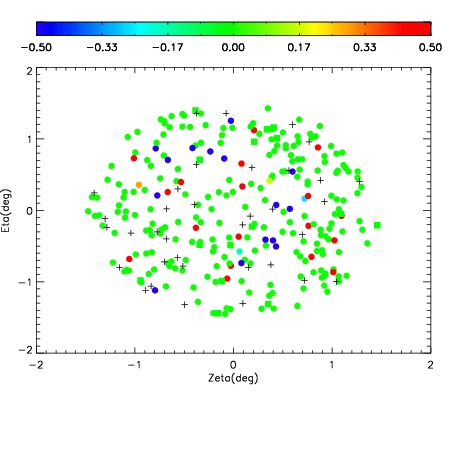
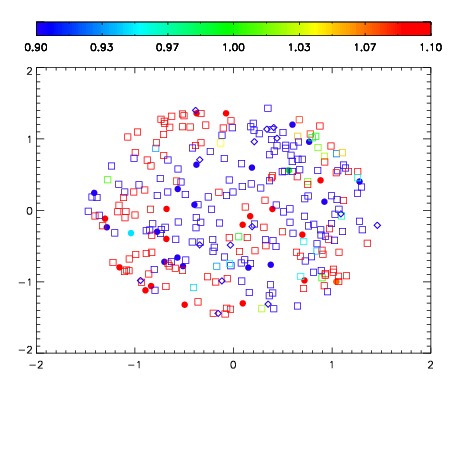
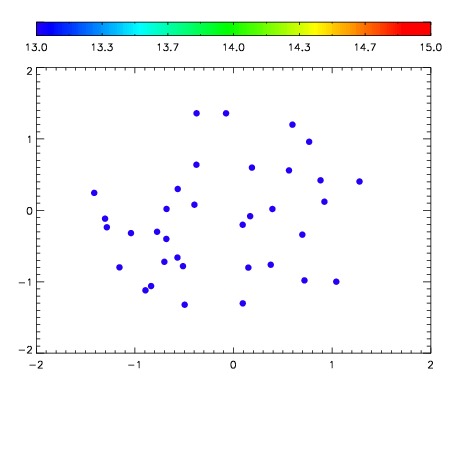

| Frame | Nreads | Zeropoints | Mag plots | Spatial mag deviation | Spatial sky 16325A emission deviations (filled: sky, open: star) | Spatial sky continuum emission | Spatial sky telluric CO2 absorption deviations (filled: H < 10) | |||||||||||||||||||||||
| 0 | 0 |
|
|
|
|
|
|
| IPAIR | NAME | SHIFT | NEWSHIFT | S/N | NAME | SHIFT | NEWSHIFT | S/N |
| 0 | 19590012 | 0.495779 | 0.00000 | 18.7452 | 19590011 | 0.00000 | 0.495779 | 18.8763 |
| 1 | 19590017 | 0.494417 | 0.00136200 | 18.6769 | 19590018 | -0.00187821 | 0.497657 | 18.6422 |
| 2 | 19590013 | 0.495132 | 0.000647008 | 18.6513 | 19590015 | -0.00145914 | 0.497238 | 18.5571 |
| 3 | 19590016 | 0.494812 | 0.000966996 | 18.6410 | 19590014 | -0.00119182 | 0.496971 | 18.3128 |