| Red | Green | Blue | |
| z | 17.66 | ||
| znorm | Inf | ||
| sky | -Inf | -Inf | -Inf |
| S/N | 20.8 | 31.9 | 40.3 |
| S/N(c) | 11.4 | 28.8 | 27.1 |
| SN(E/C) |
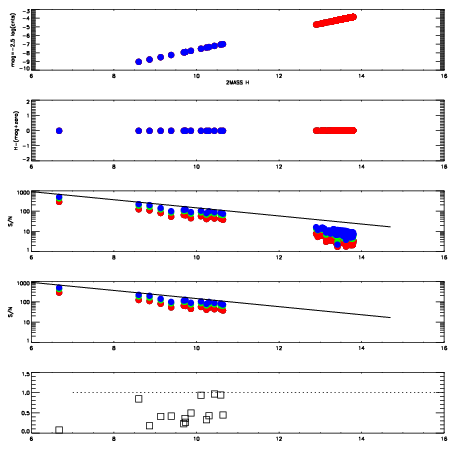
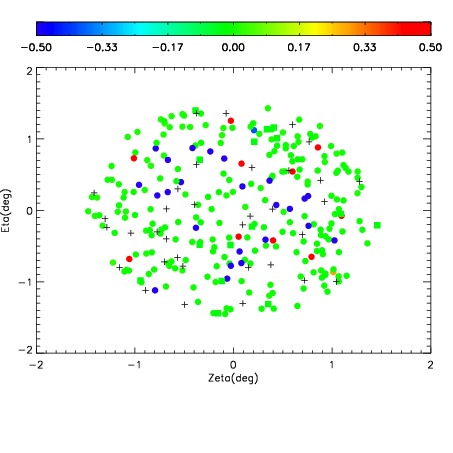
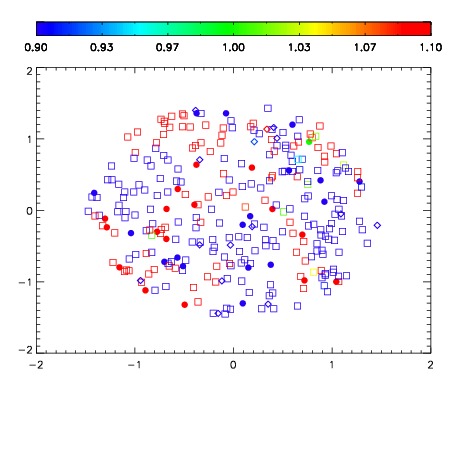
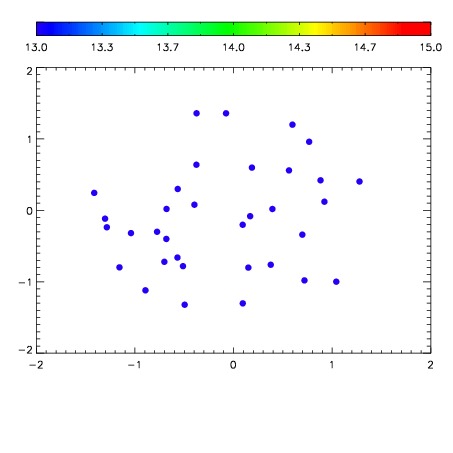

| Frame | Nreads | Zeropoints | Mag plots | Spatial mag deviation | Spatial sky 16325A emission deviations (filled: sky, open: star) | Spatial sky continuum emission | Spatial sky telluric CO2 absorption deviations (filled: H < 10) | |||||||||||||||||||||||
| 0 | 0 |
|
|
|
|
|
|
| IPAIR | NAME | SHIFT | NEWSHIFT | S/N | NAME | SHIFT | NEWSHIFT | S/N |
| 0 | 19690013 | 0.499196 | 0.00000 | 17.6952 | 19690019 | 0.00215970 | 0.497036 | 18.0243 |
| 1 | 19690016 | 0.497271 | 0.00192499 | 18.1607 | 19690015 | 0.00160235 | 0.497594 | 18.3447 |
| 2 | 19690017 | 0.498253 | 0.000943005 | 17.7074 | 19690018 | 0.00197815 | 0.497218 | 18.1099 |
| 3 | 19690021 | 0.498693 | 0.000503004 | 17.5311 | 19690014 | 0.00170672 | 0.497489 | 17.9280 |
| 4 | 19690020 | 0.498677 | 0.000519007 | 17.3422 | 19690022 | 0.00491927 | 0.494277 | 16.4438 |
| 5 | 19690012 | 0.498583 | 0.000613004 | 16.1493 | 19690011 | 0.00000 | 0.499196 | 15.8968 |