| Red | Green | Blue | |
| z | 17.65 | ||
| znorm | Inf | ||
| sky | -Inf | -Inf | -NaN |
| S/N | 19.5 | 26.7 | 31.9 |
| S/N(c) | 15.2 | 26.5 | 28.4 |
| SN(E/C) |
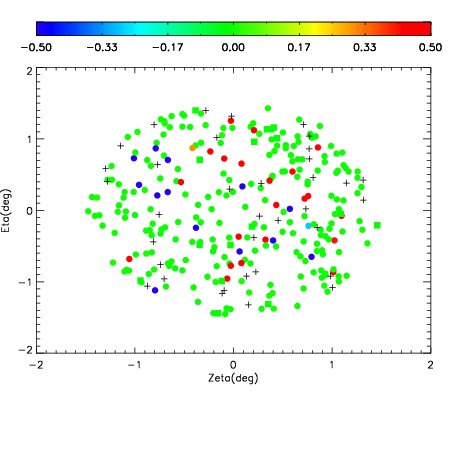
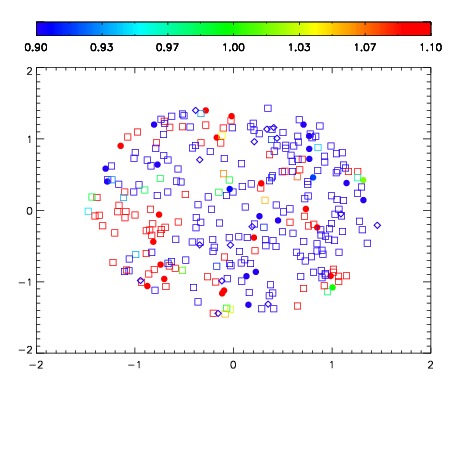
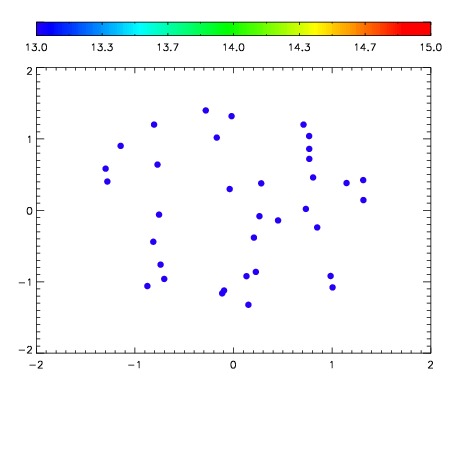

| Frame | Nreads | Zeropoints | Mag plots | Spatial mag deviation | Spatial sky 16325A emission deviations (filled: sky, open: star) | Spatial sky continuum emission | Spatial sky telluric CO2 absorption deviations (filled: H < 10) | |||||||||||||||||||||||
| 0 | 0 |
|
|
|
|
|
|
| IPAIR | NAME | SHIFT | NEWSHIFT | S/N | NAME | SHIFT | NEWSHIFT | S/N |
| 0 | 19400027 | 0.490713 | 0.00000 | 18.9454 | 19400025 | 0.00000 | 0.490713 | 18.3533 |
| 1 | 19400026 | 0.490091 | 0.000622004 | 18.7011 | 19400032 | -0.00615638 | 0.496869 | 17.8761 |
| 2 | 19400031 | 0.482517 | 0.00819600 | 18.5781 | 19400028 | -0.000634169 | 0.491347 | 16.4956 |
| 3 | 19400030 | 0.482531 | 0.00818199 | 18.1943 | 19400029 | -0.00175924 | 0.492472 | 15.9987 |