| Red | Green | Blue | |
| z | 17.64 | ||
| znorm | Inf | ||
| sky | -Inf | -Inf | -Inf |
| S/N | 34.3 | 49.1 | 62.3 |
| S/N(c) | 27.4 | 46.0 | 61.9 |
| SN(E/C) |
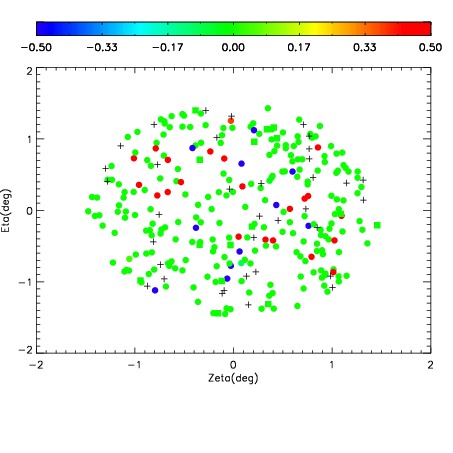
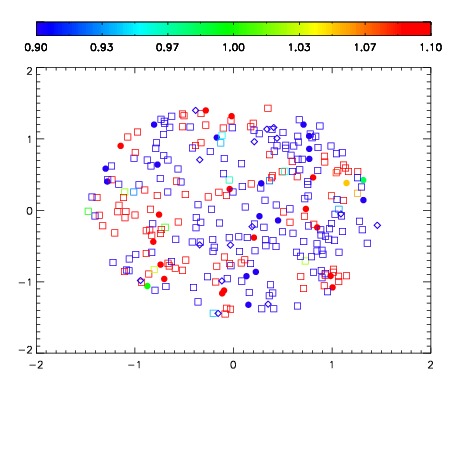
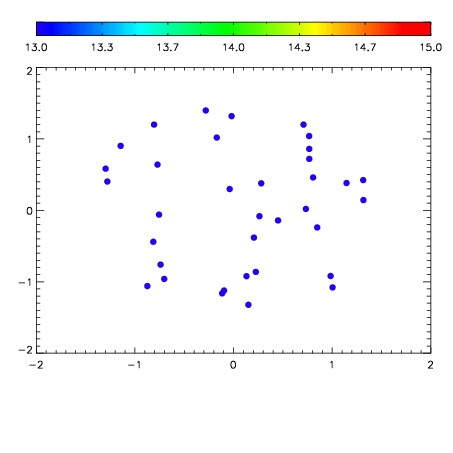

| Frame | Nreads | Zeropoints | Mag plots | Spatial mag deviation | Spatial sky 16325A emission deviations (filled: sky, open: star) | Spatial sky continuum emission | Spatial sky telluric CO2 absorption deviations (filled: H < 10) | |||||||||||||||||||||||
| 0 | 0 |
|
|
|
|
|
|
| IPAIR | NAME | SHIFT | NEWSHIFT | S/N | NAME | SHIFT | NEWSHIFT | S/N |
| 0 | 19700016 | 0.495102 | 0.00000 | 18.9510 | 19700015 | 0.000485421 | 0.494617 | 18.8729 |
| 1 | 19700012 | 0.493644 | 0.00145799 | 19.0135 | 19700014 | 0.000257467 | 0.494845 | 18.9893 |
| 2 | 19700017 | 0.495018 | 8.39829e-05 | 18.9863 | 19700011 | 0.00000 | 0.495102 | 18.9746 |
| 3 | 19700013 | 0.494110 | 0.000992000 | 18.9602 | 19700018 | 0.00698802 | 0.488114 | 18.9386 |