| Red | Green | Blue | |
| z | 17.64 | ||
| znorm | Inf | ||
| sky | -Inf | -Inf | -Inf |
| S/N | 15.0 | 27.6 | 31.4 |
| S/N(c) | 0.0 | 0.0 | 0.0 |
| SN(E/C) |
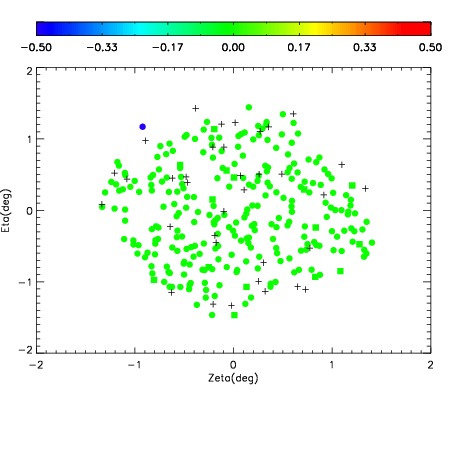
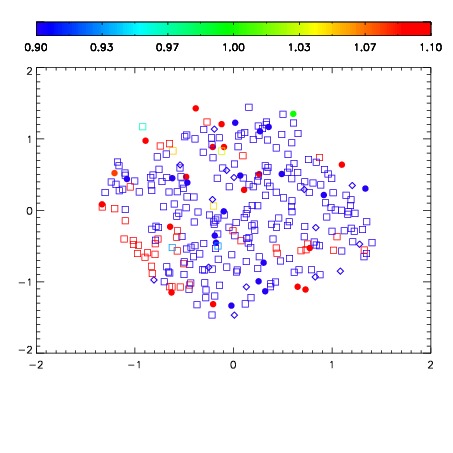
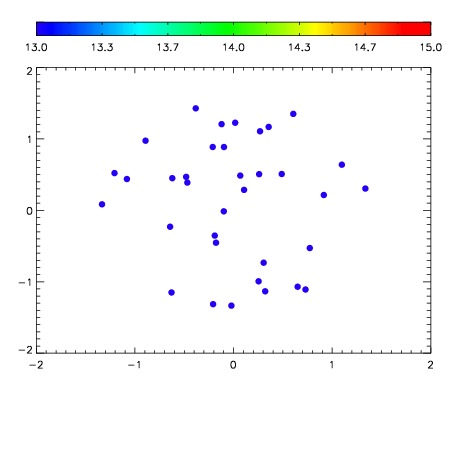

| Frame | Nreads | Zeropoints | Mag plots | Spatial mag deviation | Spatial sky 16325A emission deviations (filled: sky, open: star) | Spatial sky continuum emission | Spatial sky telluric CO2 absorption deviations (filled: H < 10) | |||||||||||||||||||||||
| 0 | 0 |
|
|
|
|
|
|
| IPAIR | NAME | SHIFT | NEWSHIFT | S/N | NAME | SHIFT | NEWSHIFT | S/N |
| 0 | 19420051 | 0.485420 | 0.00000 | 16.1844 | 19420050 | -0.00219813 | 0.487618 | 18.0157 |
| 1 | 19420047 | 0.483407 | 0.00201300 | 18.7481 | 19420046 | 0.00000 | 0.485420 | 18.4247 |
| 2 | 19420048 | 0.482647 | 0.00277299 | 18.6359 | 19420049 | -0.00163763 | 0.487058 | 18.3277 |