| Red | Green | Blue | |
| z | 17.64 | ||
| znorm | Inf | ||
| sky | -Inf | -NaN | -Inf |
| S/N | 22.9 | 42.1 | 45.6 |
| S/N(c) | 0.0 | 0.0 | 0.0 |
| SN(E/C) |
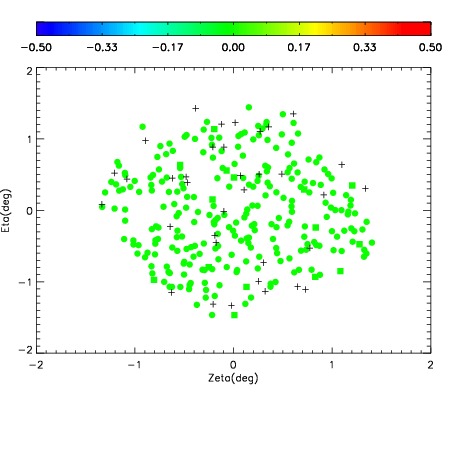
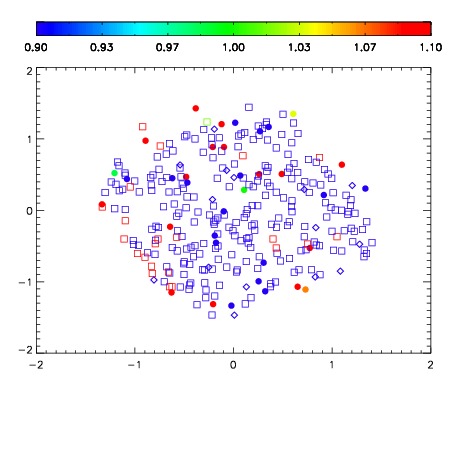
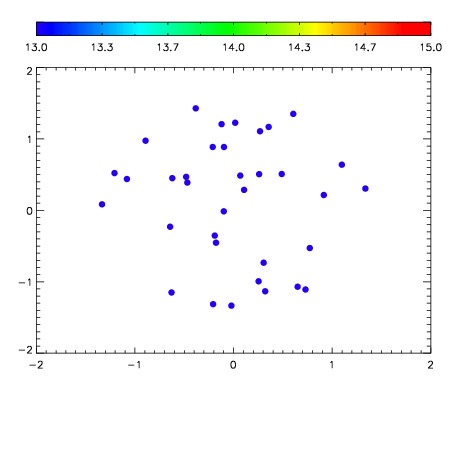

| Frame | Nreads | Zeropoints | Mag plots | Spatial mag deviation | Spatial sky 16325A emission deviations (filled: sky, open: star) | Spatial sky continuum emission | Spatial sky telluric CO2 absorption deviations (filled: H < 10) | |||||||||||||||||||||||
| 0 | 0 |
|
|
|
|
|
|
| IPAIR | NAME | SHIFT | NEWSHIFT | S/N | NAME | SHIFT | NEWSHIFT | S/N |
| 0 | 19430053 | 0.00644369 | 0.00000 | 18.6855 | 19430052 | -0.482907 | 0.489351 | 18.7285 |
| 1 | 19430049 | 0.00318256 | 0.00326113 | 18.7989 | 19430051 | -0.481857 | 0.488301 | 18.8618 |
| 2 | 19430050 | 0.00392158 | 0.00252211 | 18.7750 | 19430048 | -0.482819 | 0.489263 | 18.7333 |
| 3 | 19430046 | 0.00000 | 0.00644369 | 18.5164 | 19430047 | -0.482906 | 0.489350 | 18.6623 |