| Red | Green | Blue | |
| z | 17.64 | ||
| znorm | Inf | ||
| sky | -NaN | -Inf | -Inf |
| S/N | 24.5 | 39.2 | 46.7 |
| S/N(c) | 0.0 | 0.0 | 0.0 |
| SN(E/C) |
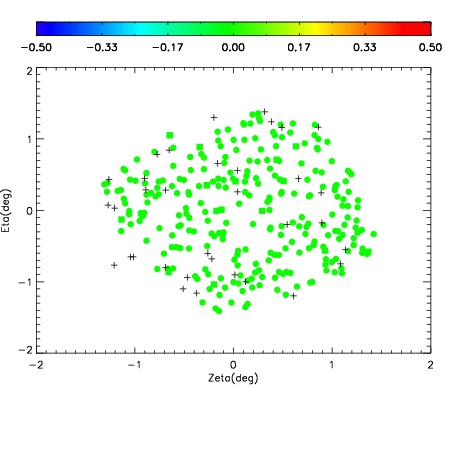
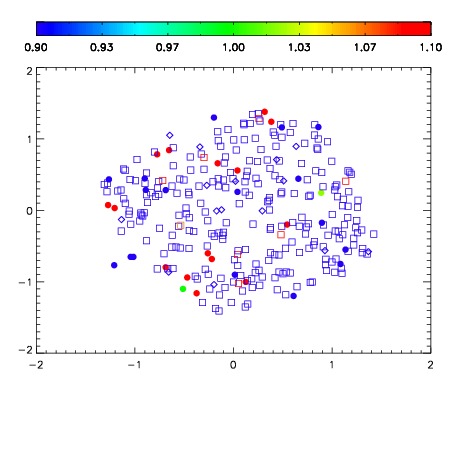
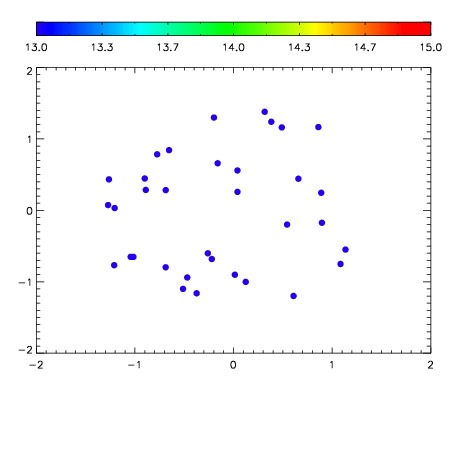

| Frame | Nreads | Zeropoints | Mag plots | Spatial mag deviation | Spatial sky 16325A emission deviations (filled: sky, open: star) | Spatial sky continuum emission | Spatial sky telluric CO2 absorption deviations (filled: H < 10) | |||||||||||||||||||||||
| 0 | 0 |
|
|
|
|
|
|
| IPAIR | NAME | SHIFT | NEWSHIFT | S/N | NAME | SHIFT | NEWSHIFT | S/N |
| 0 | 19660054 | 0.00000 | 0.00000 | 19.0009 | 19660055 | -0.486361 | 0.486361 | 19.0050 |
| 1 | 19660061 | -0.00104017 | 0.00104017 | 19.0871 | 19660060 | -0.485337 | 0.485337 | 19.0797 |
| 2 | 19660058 | -0.00160023 | 0.00160023 | 19.0550 | 19660059 | -0.485748 | 0.485748 | 19.0795 |
| 3 | 19660057 | -0.00223737 | 0.00223737 | 19.0453 | 19660056 | -0.486314 | 0.486314 | 19.0069 |