| Red | Green | Blue | |
| z | 17.64 | ||
| znorm | Inf | ||
| sky | -Inf | -Inf | -NaN |
| S/N | 23.0 | 36.7 | 43.6 |
| S/N(c) | 0.0 | 0.0 | 0.0 |
| SN(E/C) |
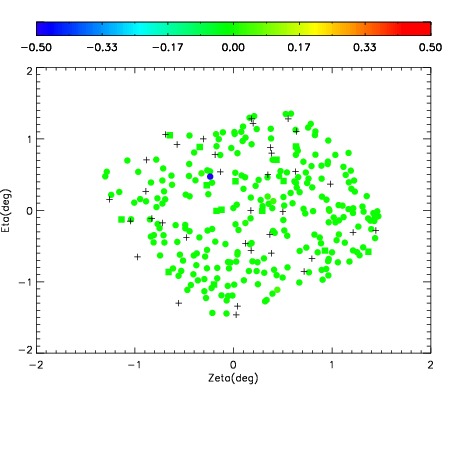
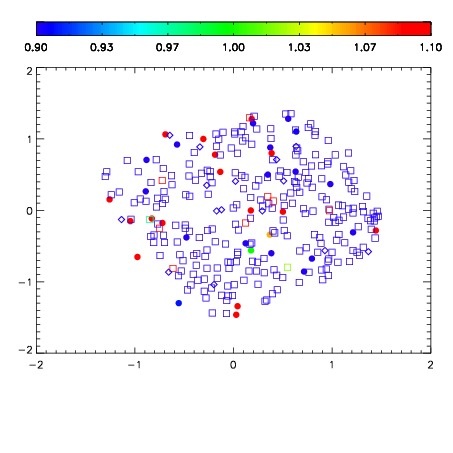
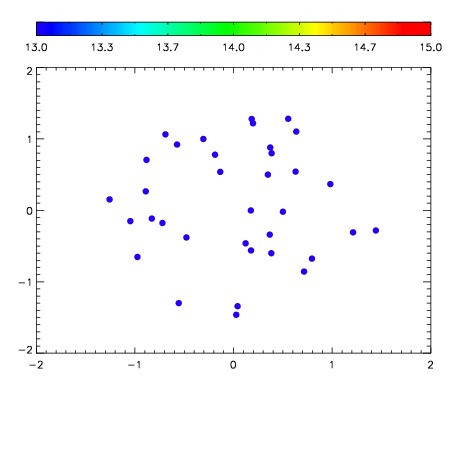

| Frame | Nreads | Zeropoints | Mag plots | Spatial mag deviation | Spatial sky 16325A emission deviations (filled: sky, open: star) | Spatial sky continuum emission | Spatial sky telluric CO2 absorption deviations (filled: H < 10) | |||||||||||||||||||||||
| 0 | 0 |
|
|
|
|
|
|
| IPAIR | NAME | SHIFT | NEWSHIFT | S/N | NAME | SHIFT | NEWSHIFT | S/N |
| 0 | 19680056 | 0.00369227 | 0.00000 | 18.7946 | 19680055 | -0.483038 | 0.486730 | 18.7668 |
| 1 | 19680053 | 0.00192315 | 0.00176912 | 18.9993 | 19680054 | -0.482530 | 0.486222 | 18.7921 |
| 2 | 19680049 | 0.00000 | 0.00369227 | 18.7477 | 19680050 | -0.480749 | 0.484441 | 18.6813 |
| 3 | 19680052 | 0.00212133 | 0.00157094 | 18.3805 | 19680051 | -0.481391 | 0.485083 | 18.3100 |