| Red | Green | Blue | |
| z | 17.64 | ||
| znorm | Inf | ||
| sky | -Inf | -Inf | -Inf |
| S/N | 12.4 | 22.4 | 24.1 |
| S/N(c) | 0.0 | 0.0 | 0.0 |
| SN(E/C) |
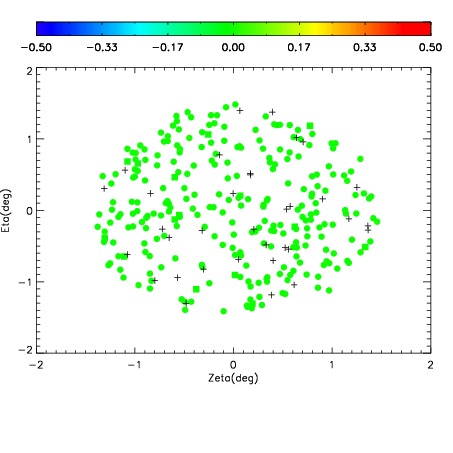
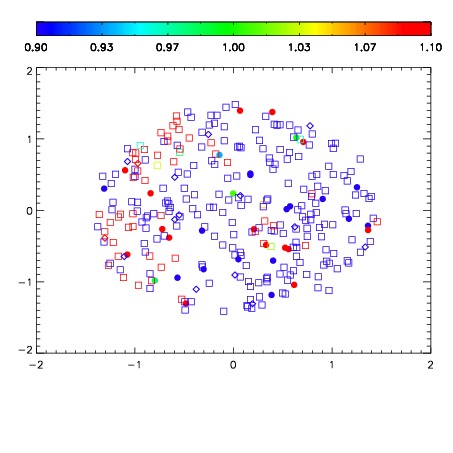


| Frame | Nreads | Zeropoints | Mag plots | Spatial mag deviation | Spatial sky 16325A emission deviations (filled: sky, open: star) | Spatial sky continuum emission | Spatial sky telluric CO2 absorption deviations (filled: H < 10) | |||||||||||||||||||||||
| 0 | 0 |
|
|
|
|
|
|
| IPAIR | NAME | SHIFT | NEWSHIFT | S/N | NAME | SHIFT | NEWSHIFT | S/N |
| 0 | 20070031 | 0.504658 | 0.00000 | 17.6767 | 20070026 | 0.00000 | 0.504658 | 17.8403 |
| 1 | 20070028 | 0.501530 | 0.00312799 | 18.0254 | 20070029 | -0.000793272 | 0.505451 | 18.3045 |
| 2 | 20070027 | 0.500448 | 0.00421000 | 18.0175 | 20070030 | -0.00127258 | 0.505931 | 17.9276 |