| Red | Green | Blue | |
| z | 17.64 | ||
| znorm | Inf | ||
| sky | -Inf | -Inf | -Inf |
| S/N | 22.2 | 39.6 | 43.0 |
| S/N(c) | 0.0 | 0.0 | 0.0 |
| SN(E/C) |
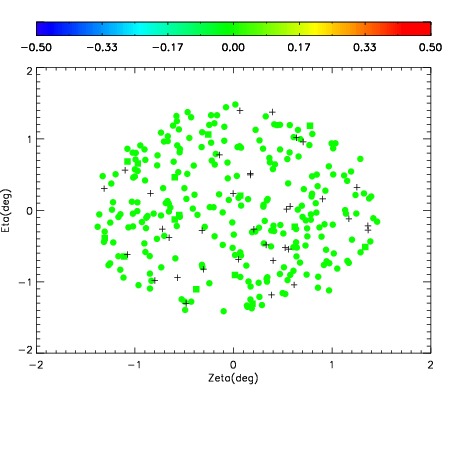
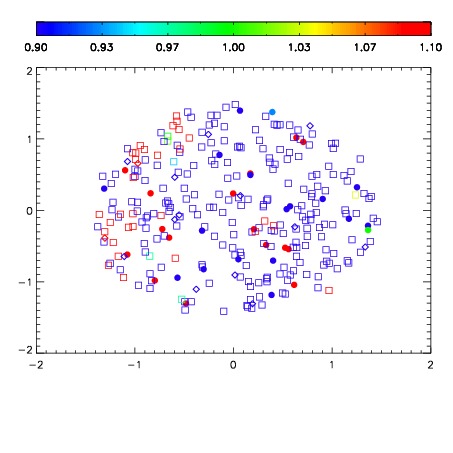
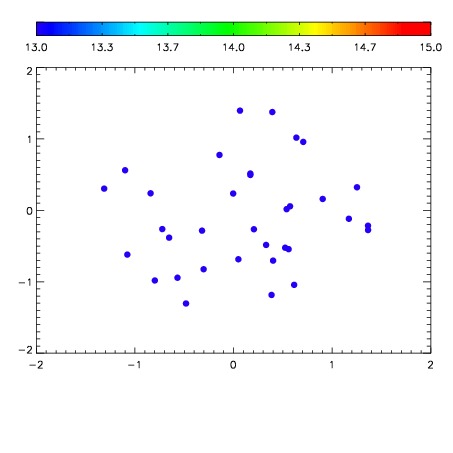

| Frame | Nreads | Zeropoints | Mag plots | Spatial mag deviation | Spatial sky 16325A emission deviations (filled: sky, open: star) | Spatial sky continuum emission | Spatial sky telluric CO2 absorption deviations (filled: H < 10) | |||||||||||||||||||||||
| 0 | 0 |
|
|
|
|
|
|
| IPAIR | NAME | SHIFT | NEWSHIFT | S/N | NAME | SHIFT | NEWSHIFT | S/N |
| 0 | 20080020 | 0.507605 | 0.00000 | 18.2265 | 20080011 | 0.00000 | 0.507605 | 18.2949 |
| 1 | 20080013 | 0.504114 | 0.00349104 | 18.4467 | 20080014 | -0.000102940 | 0.507708 | 18.4921 |
| 2 | 20080017 | 0.502458 | 0.00514704 | 18.4358 | 20080019 | -0.000828194 | 0.508433 | 18.4598 |
| 3 | 20080016 | 0.501792 | 0.00581300 | 18.4258 | 20080018 | -0.00100938 | 0.508614 | 18.3762 |
| 4 | 20080012 | 0.503426 | 0.00417900 | 18.3946 | 20080015 | -0.000955150 | 0.508560 | 18.3761 |
| 5 | 20080021 | 0.507260 | 0.000344992 | 17.9569 | 20080022 | 0.00542567 | 0.502179 | 17.9544 |