| Red | Green | Blue | |
| z | 17.64 | ||
| znorm | Inf | ||
| sky | -Inf | -Inf | -Inf |
| S/N | 16.4 | 28.9 | 31.4 |
| S/N(c) | 0.0 | 0.0 | 0.0 |
| SN(E/C) |
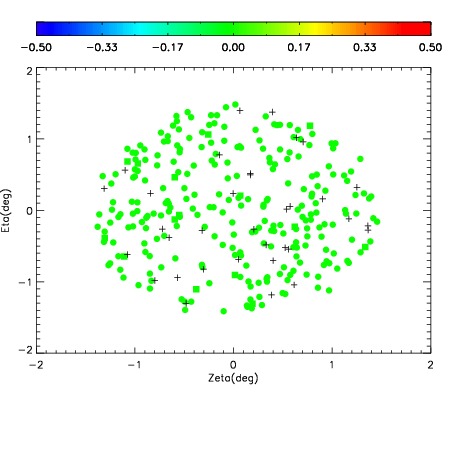

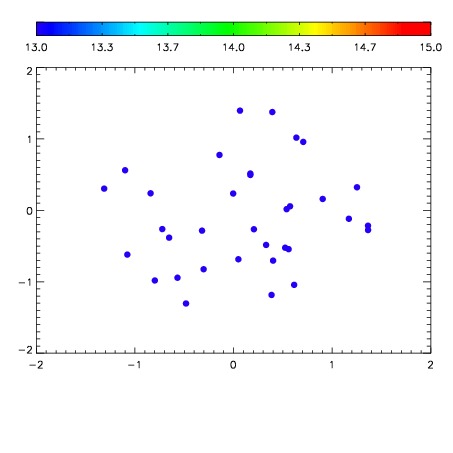

| Frame | Nreads | Zeropoints | Mag plots | Spatial mag deviation | Spatial sky 16325A emission deviations (filled: sky, open: star) | Spatial sky continuum emission | Spatial sky telluric CO2 absorption deviations (filled: H < 10) | |||||||||||||||||||||||
| 0 | 0 |
|
|
|
|
|
|
| IPAIR | NAME | SHIFT | NEWSHIFT | S/N | NAME | SHIFT | NEWSHIFT | S/N |
| 0 | 20100016 | 0.506102 | 0.00000 | 18.3681 | 20100014 | -0.00244108 | 0.508543 | 18.3974 |
| 1 | 20100013 | 0.505949 | 0.000153005 | 18.3521 | 20100015 | -0.00296055 | 0.509063 | 18.2838 |
| 2 | 20100012 | 0.504148 | 0.00195402 | 18.3234 | 20100011 | 0.00000 | 0.506102 | 18.2734 |