| Red | Green | Blue | |
| z | 17.64 | ||
| znorm | Inf | ||
| sky | -Inf | -Inf | -Inf |
| S/N | 17.9 | 30.1 | 35.8 |
| S/N(c) | 0.0 | 0.0 | 0.0 |
| SN(E/C) |
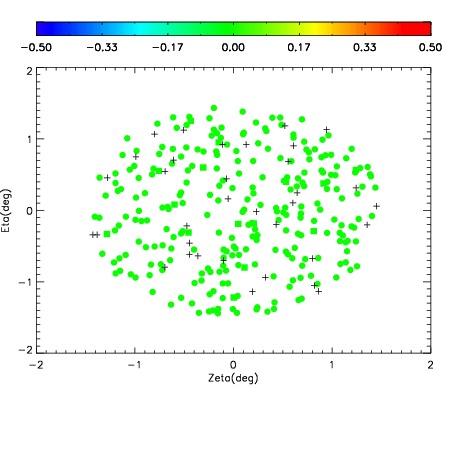
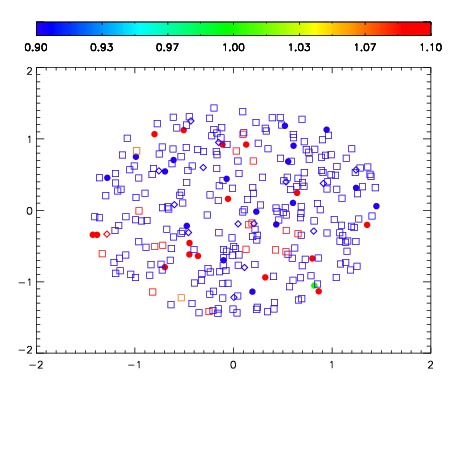
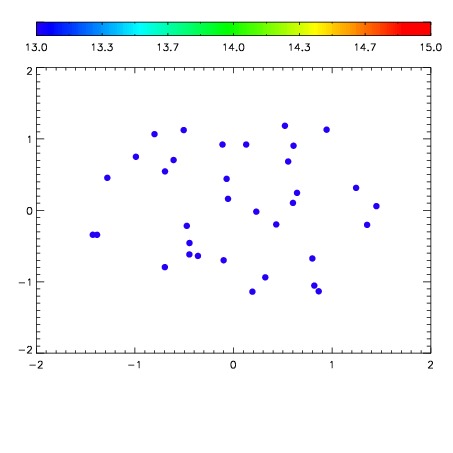

| Frame | Nreads | Zeropoints | Mag plots | Spatial mag deviation | Spatial sky 16325A emission deviations (filled: sky, open: star) | Spatial sky continuum emission | Spatial sky telluric CO2 absorption deviations (filled: H < 10) | |||||||||||||||||||||||
| 0 | 0 |
|
|
|
|
|
|
| IPAIR | NAME | SHIFT | NEWSHIFT | S/N | NAME | SHIFT | NEWSHIFT | S/N |
| 0 | 19510055 | 0.491378 | 0.00000 | 18.4433 | 19510056 | 0.00374716 | 0.487631 | 18.4319 |
| 1 | 19510054 | 0.489417 | 0.00196102 | 18.5195 | 19510053 | 0.00000 | 0.491378 | 18.4818 |
| 2 | 19510058 | 0.490604 | 0.000773996 | 18.0274 | 19510057 | 0.00298188 | 0.488396 | 18.0571 |
| 3 | 19510059 | 0.490786 | 0.000592023 | 17.9075 | 19510060 | 0.00523993 | 0.486138 | 17.9940 |