| Red | Green | Blue | |
| z | 17.64 | ||
| znorm | Inf | ||
| sky | -Inf | -Inf | -Inf |
| S/N | 12.7 | 23.9 | 27.5 |
| S/N(c) | 0.0 | 0.0 | 0.0 |
| SN(E/C) |
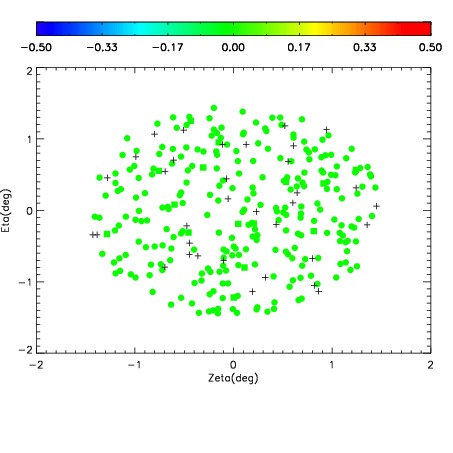
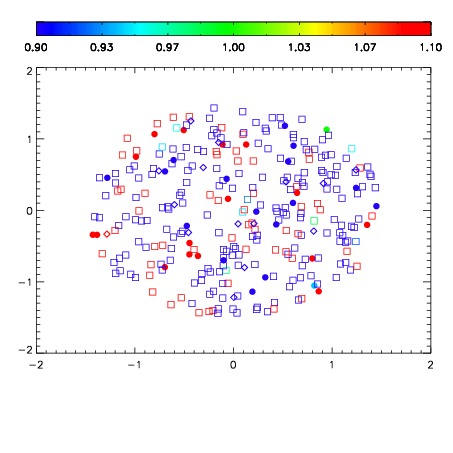
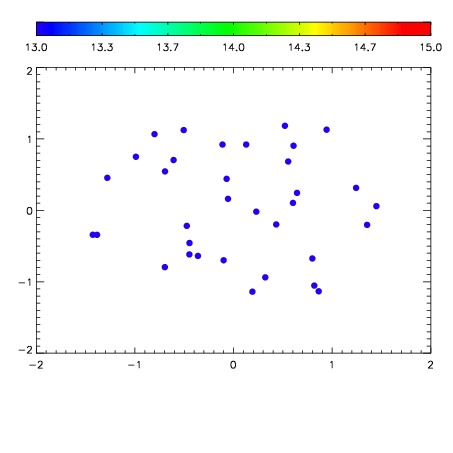

| Frame | Nreads | Zeropoints | Mag plots | Spatial mag deviation | Spatial sky 16325A emission deviations (filled: sky, open: star) | Spatial sky continuum emission | Spatial sky telluric CO2 absorption deviations (filled: H < 10) | |||||||||||||||||||||||
| 0 | 0 |
|
|
|
|
|
|
| IPAIR | NAME | SHIFT | NEWSHIFT | S/N | NAME | SHIFT | NEWSHIFT | S/N |
| 0 | 19520040 | 0.489115 | 0.00000 | 17.2639 | 19520046 | 0.00102054 | 0.488094 | 17.6901 |
| 1 | 19520043 | 0.488833 | 0.000281990 | 17.7279 | 19520045 | 0.00206970 | 0.487045 | 17.7997 |
| 2 | 19520044 | 0.488978 | 0.000137001 | 17.6947 | 19520042 | 0.000885590 | 0.488229 | 17.7239 |
| 3 | 19520039 | 0.488787 | 0.000328004 | 17.1436 | 19520041 | 0.000583358 | 0.488532 | 17.5413 |
| 4 | 19520036 | 0.486370 | 0.00274500 | 16.9339 | 19520038 | 0.000179133 | 0.488936 | 17.1891 |
| 5 | 19520035 | 0.486822 | 0.00229299 | 16.6677 | 19520037 | 0.000872387 | 0.488243 | 16.9222 |