| Red | Green | Blue | |
| z | 17.64 | ||
| znorm | Inf | ||
| sky | -Inf | -Inf | -Inf |
| S/N | 21.2 | 37.7 | 44.3 |
| S/N(c) | 0.0 | 0.0 | 0.0 |
| SN(E/C) |
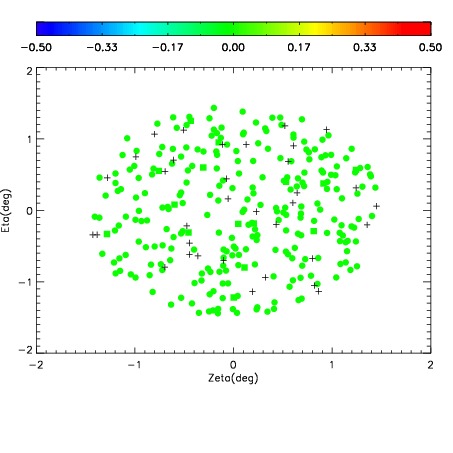
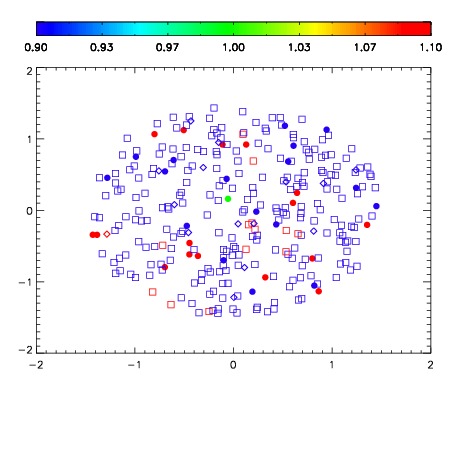
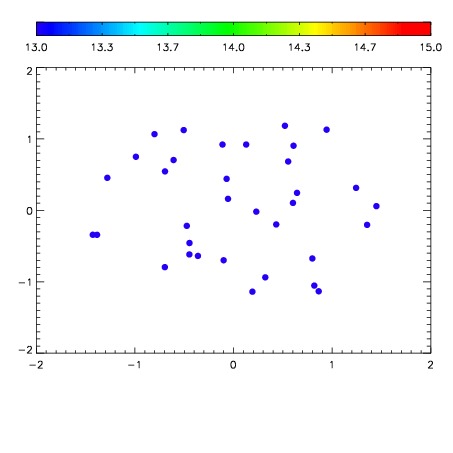

| Frame | Nreads | Zeropoints | Mag plots | Spatial mag deviation | Spatial sky 16325A emission deviations (filled: sky, open: star) | Spatial sky continuum emission | Spatial sky telluric CO2 absorption deviations (filled: H < 10) | |||||||||||||||||||||||
| 0 | 0 |
|
|
|
|
|
|
| IPAIR | NAME | SHIFT | NEWSHIFT | S/N | NAME | SHIFT | NEWSHIFT | S/N |
| 0 | 19530013 | 0.490677 | 0.00000 | 17.8957 | 19530014 | 0.000472064 | 0.490205 | 17.8307 |
| 1 | 19530024 | 0.486769 | 0.00390801 | 18.4415 | 19530023 | -0.00137632 | 0.492053 | 18.4674 |
| 2 | 19530017 | 0.488934 | 0.00174299 | 18.1207 | 19530018 | -0.00136628 | 0.492043 | 18.2101 |
| 3 | 19530020 | 0.488445 | 0.00223199 | 18.0212 | 19530019 | -0.000178812 | 0.490856 | 18.0847 |
| 4 | 19530016 | 0.489404 | 0.00127301 | 18.0024 | 19530015 | -0.00150387 | 0.492181 | 18.0675 |
| 5 | 19530012 | 0.490068 | 0.000609010 | 17.9604 | 19530022 | -0.000778448 | 0.491455 | 18.0554 |
| 6 | 19530021 | 0.487186 | 0.00349098 | 17.9261 | 19530011 | 0.00000 | 0.490677 | 17.9396 |