| Red | Green | Blue | |
| z | 17.64 | ||
| znorm | Inf | ||
| sky | -Inf | -Inf | -Inf |
| S/N | 4.5 | 9.1 | 9.6 |
| S/N(c) | 0.0 | 0.0 | 0.0 |
| SN(E/C) |

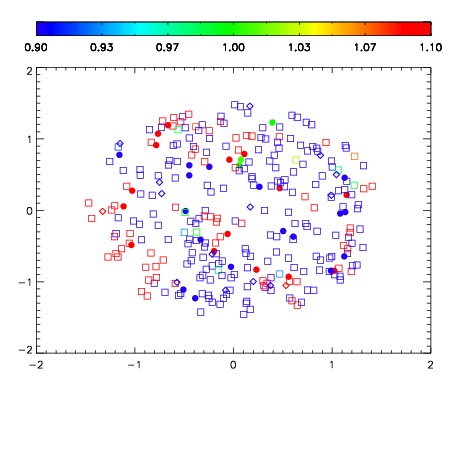
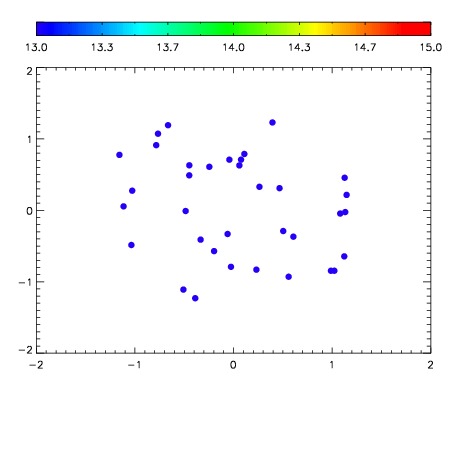

| Frame | Nreads | Zeropoints | Mag plots | Spatial mag deviation | Spatial sky 16325A emission deviations (filled: sky, open: star) | Spatial sky continuum emission | Spatial sky telluric CO2 absorption deviations (filled: H < 10) | |||||||||||||||||||||||
| 0 | 0 |
|
|
|
|
|
|
| IPAIR | NAME | SHIFT | NEWSHIFT | S/N | NAME | SHIFT | NEWSHIFT | S/N |
| 0 | 19580051 | 0.00205897 | 0.00000 | 17.6369 | 19580050 | -0.494874 | 0.496933 | 17.2808 |
| 1 | 19580048 | 0.00000 | 0.00205897 | 17.9440 | 19580053 | -0.496963 | 0.499022 | 17.5455 |
| 2 | 19580052 | 0.00168865 | 0.000370320 | 17.4628 | 19580049 | -0.494263 | 0.496322 | 17.2586 |