| Red | Green | Blue | |
| z | 17.64 | ||
| znorm | Inf | ||
| sky | -Inf | -Inf | -Inf |
| S/N | 2.5 | 5.3 | 5.6 |
| S/N(c) | 0.0 | 0.0 | 0.0 |
| SN(E/C) |
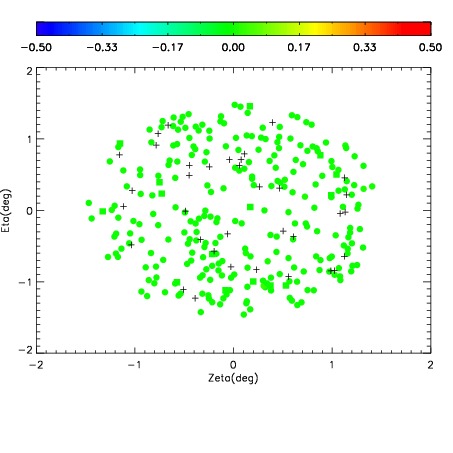
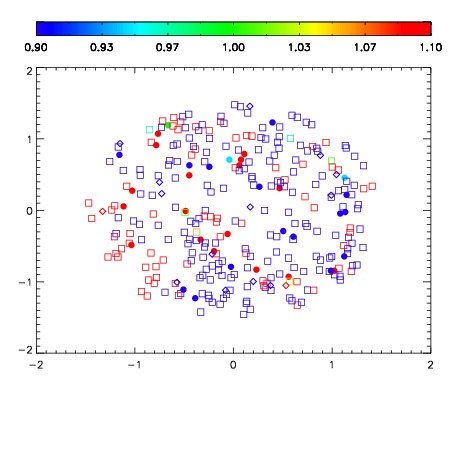
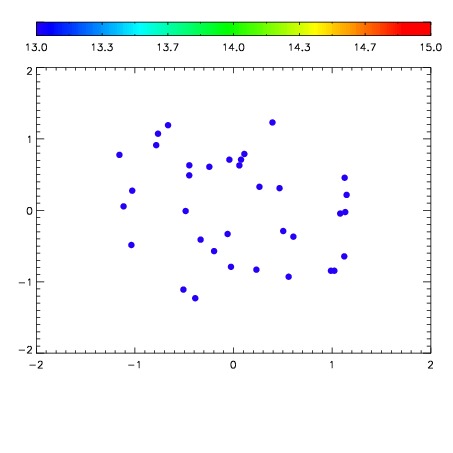

| Frame | Nreads | Zeropoints | Mag plots | Spatial mag deviation | Spatial sky 16325A emission deviations (filled: sky, open: star) | Spatial sky continuum emission | Spatial sky telluric CO2 absorption deviations (filled: H < 10) | |||||||||||||||||||||||
| 0 | 0 |
|
|
|
|
|
|
| IPAIR | NAME | SHIFT | NEWSHIFT | S/N | NAME | SHIFT | NEWSHIFT | S/N |
| 0 | 19600061 | 0.499075 | 0.00000 | 17.0730 | 19600063 | 0.00603415 | 0.493041 | 17.1015 |
| 1 | 19600066 | 0.498610 | 0.000465006 | 17.9647 | 19600065 | 0.00621503 | 0.492860 | 17.9382 |
| 2 | 19600062 | 0.498917 | 0.000157982 | 17.5693 | 19600060 | 0.00000 | 0.499075 | 17.2572 |