| Red | Green | Blue | |
| z | 17.64 | ||
| znorm | Inf | ||
| sky | -Inf | -Inf | -Inf |
| S/N | 11.9 | 19.6 | 22.6 |
| S/N(c) | 0.0 | 0.0 | 0.0 |
| SN(E/C) |
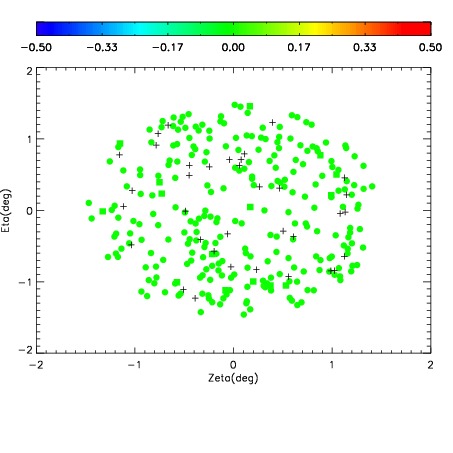
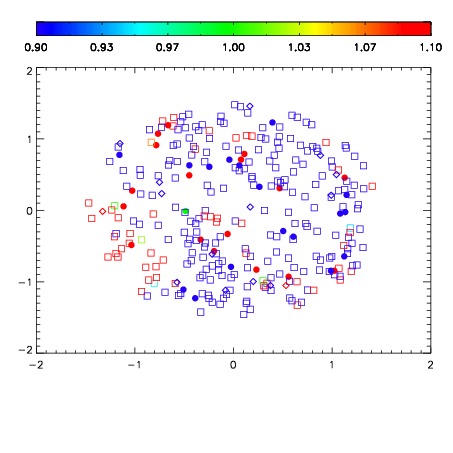
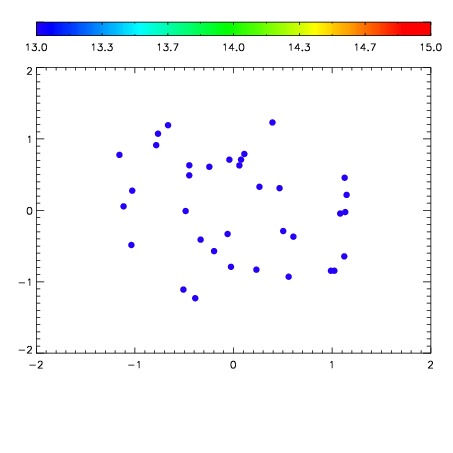

| Frame | Nreads | Zeropoints | Mag plots | Spatial mag deviation | Spatial sky 16325A emission deviations (filled: sky, open: star) | Spatial sky continuum emission | Spatial sky telluric CO2 absorption deviations (filled: H < 10) | |||||||||||||||||||||||
| 0 | 0 |
|
|
|
|
|
|
| IPAIR | NAME | SHIFT | NEWSHIFT | S/N | NAME | SHIFT | NEWSHIFT | S/N |
| 0 | 19760023 | 0.00000 | 0.00000 | 17.7803 | 19760024 | -0.493382 | 0.493382 | 17.7745 |
| 1 | 19760027 | -0.00259103 | 0.00259103 | 18.7156 | 19760028 | -0.491632 | 0.491632 | 18.6176 |
| 2 | 19760026 | -0.00232657 | 0.00232657 | 18.0745 | 19760025 | -0.493498 | 0.493498 | 17.9696 |