| Red | Green | Blue | |
| z | 17.64 | ||
| znorm | Inf | ||
| sky | -Inf | -Inf | -NaN |
| S/N | 17.3 | 31.7 | 34.2 |
| S/N(c) | 0.0 | 0.0 | 0.0 |
| SN(E/C) |


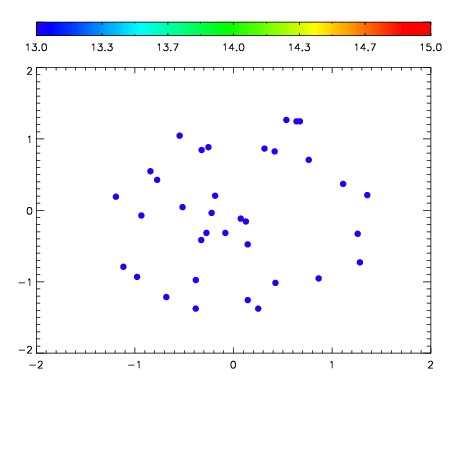

| Frame | Nreads | Zeropoints | Mag plots | Spatial mag deviation | Spatial sky 16325A emission deviations (filled: sky, open: star) | Spatial sky continuum emission | Spatial sky telluric CO2 absorption deviations (filled: H < 10) | |||||||||||||||||||||||
| 0 | 0 |
|
|
|
|
|
|
| IPAIR | NAME | SHIFT | NEWSHIFT | S/N | NAME | SHIFT | NEWSHIFT | S/N |
| 0 | 20130030 | 0.506698 | 0.00000 | 18.3072 | 20130029 | 0.00811618 | 0.498582 | 18.5047 |
| 1 | 20130027 | 0.505742 | 0.000955999 | 18.6358 | 20130028 | 0.00773700 | 0.498961 | 18.5274 |
| 2 | 20130026 | 0.505032 | 0.00166601 | 18.2750 | 20130025 | 0.00262743 | 0.504071 | 18.2582 |
| 3 | 20130022 | 0.503726 | 0.00297201 | 17.9205 | 20130021 | 0.00000 | 0.506698 | 18.1132 |
| 4 | 20130023 | 0.504883 | 0.00181502 | 17.8368 | 20130032 | 0.00524686 | 0.501451 | 16.8670 |