| Red | Green | Blue | |
| z | 17.64 | ||
| znorm | Inf | ||
| sky | -Inf | -Inf | -Inf |
| S/N | 24.0 | 43.5 | 46.2 |
| S/N(c) | 0.0 | 0.0 | 0.0 |
| SN(E/C) |
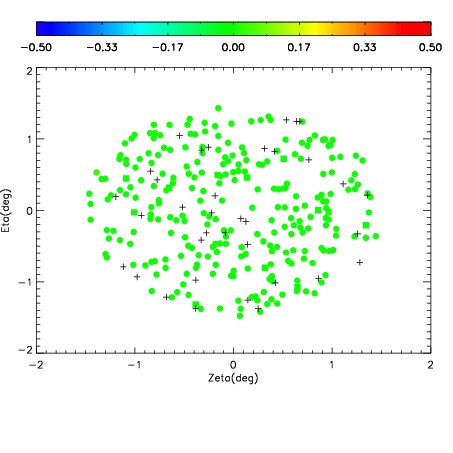
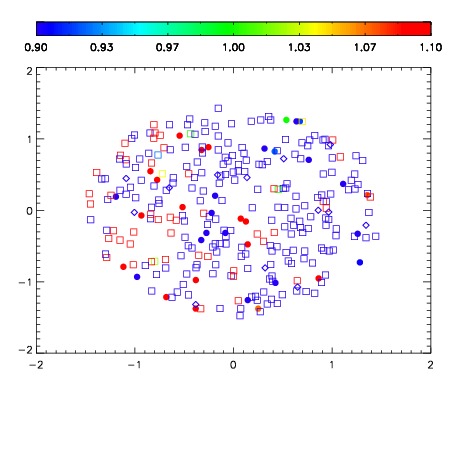


| Frame | Nreads | Zeropoints | Mag plots | Spatial mag deviation | Spatial sky 16325A emission deviations (filled: sky, open: star) | Spatial sky continuum emission | Spatial sky telluric CO2 absorption deviations (filled: H < 10) | |||||||||||||||||||||||
| 0 | 0 |
|
|
|
|
|
|
| IPAIR | NAME | SHIFT | NEWSHIFT | S/N | NAME | SHIFT | NEWSHIFT | S/N |
| 0 | 20140016 | 0.497474 | 0.00000 | 18.3153 | 20140013 | -0.00344501 | 0.500919 | 18.4545 |
| 1 | 20140015 | 0.496190 | 0.00128400 | 18.3067 | 20140017 | 0.00173890 | 0.495735 | 18.4037 |
| 2 | 20140011 | 0.496393 | 0.00108102 | 18.2645 | 20140014 | -0.00286800 | 0.500342 | 18.3268 |
| 3 | 20140019 | 0.495375 | 0.00209901 | 18.2276 | 20140010 | 0.00000 | 0.497474 | 18.3150 |
| 4 | 20140020 | 0.497014 | 0.000460029 | 18.1284 | 20140018 | 0.00200196 | 0.495472 | 18.1798 |
| 5 | 20140012 | 0.496738 | 0.000736028 | 18.0578 | 20140021 | -0.00620865 | 0.503683 | 18.1082 |