| Red | Green | Blue | |
| z | 17.64 | ||
| znorm | Inf | ||
| sky | -Inf | -NaN | -NaN |
| S/N | 20.9 | 35.7 | 38.8 |
| S/N(c) | 0.0 | 0.0 | 0.0 |
| SN(E/C) |
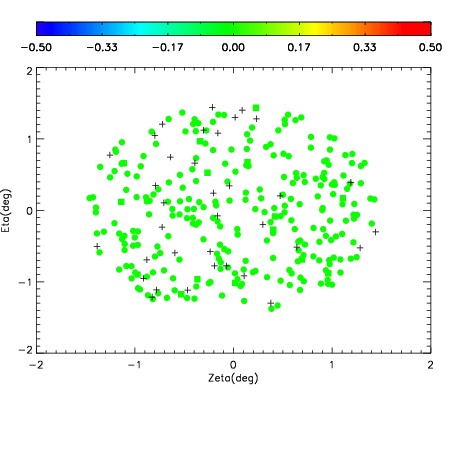
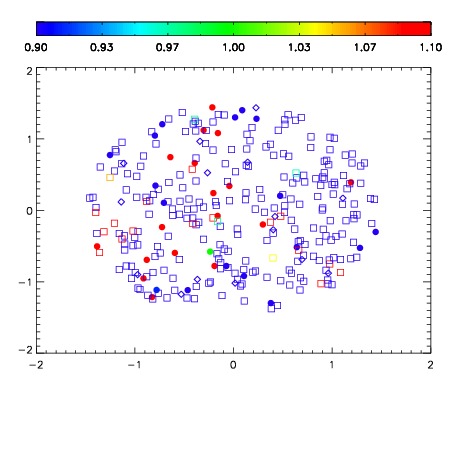
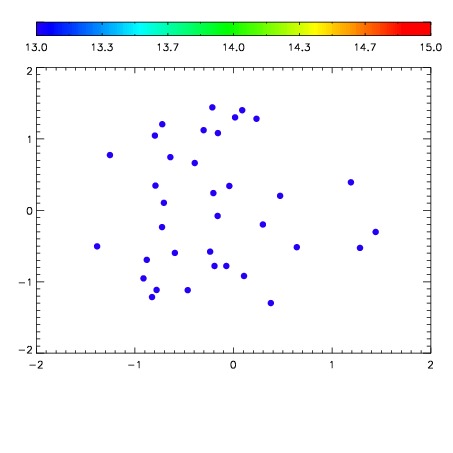

| Frame | Nreads | Zeropoints | Mag plots | Spatial mag deviation | Spatial sky 16325A emission deviations (filled: sky, open: star) | Spatial sky continuum emission | Spatial sky telluric CO2 absorption deviations (filled: H < 10) | |||||||||||||||||||||||
| 0 | 0 |
|
|
|
|
|
|
| IPAIR | NAME | SHIFT | NEWSHIFT | S/N | NAME | SHIFT | NEWSHIFT | S/N |
| 0 | 19480022 | 0.493044 | 0.00000 | 18.4785 | 19480021 | 0.00129939 | 0.491745 | 18.4662 |
| 1 | 19480014 | 0.489200 | 0.00384399 | 18.5513 | 19480013 | 0.00000 | 0.493044 | 18.4850 |
| 2 | 19480019 | 0.488338 | 0.00470600 | 18.4394 | 19480020 | 0.000483561 | 0.492560 | 18.4189 |
| 3 | 19480015 | 0.490581 | 0.00246298 | 18.3805 | 19480016 | 0.000863590 | 0.492180 | 18.3777 |
| 4 | 19480018 | 0.488730 | 0.00431398 | 18.1019 | 19480017 | 0.000353833 | 0.492690 | 18.1370 |
| 5 | 19480023 | 0.492570 | 0.000473976 | 17.9063 | 19480024 | 0.000401894 | 0.492642 | 17.7990 |