| Red | Green | Blue | |
| z | 17.64 | ||
| znorm | Inf | ||
| sky | -NaN | -NaN | -NaN |
| S/N | 15.8 | 27.9 | 31.0 |
| S/N(c) | 0.0 | 0.0 | 0.0 |
| SN(E/C) |
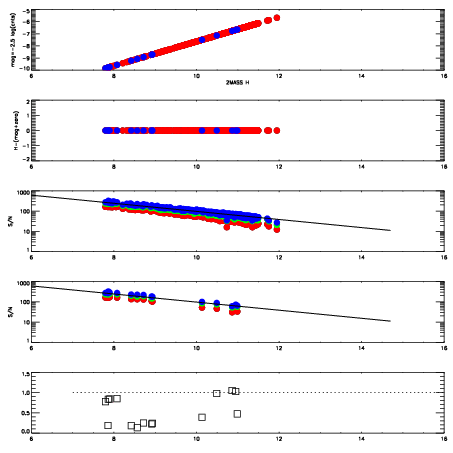
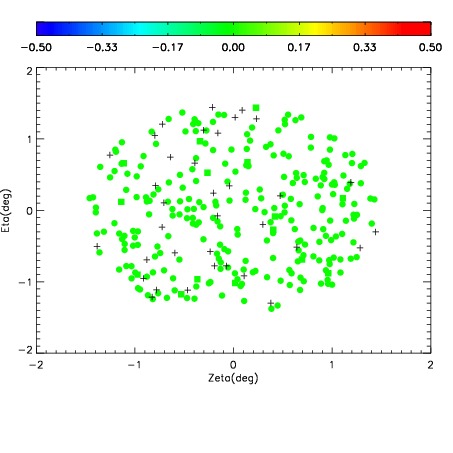
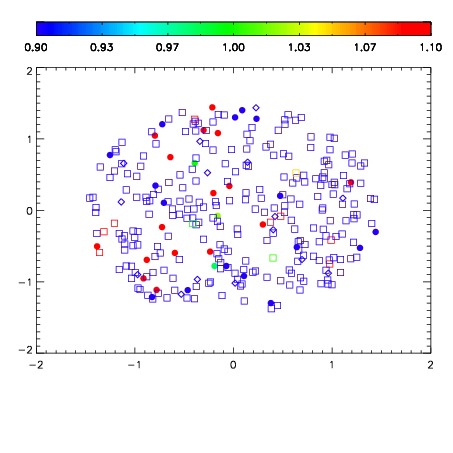


| Frame | Nreads | Zeropoints | Mag plots | Spatial mag deviation | Spatial sky 16325A emission deviations (filled: sky, open: star) | Spatial sky continuum emission | Spatial sky telluric CO2 absorption deviations (filled: H < 10) | |||||||||||||||||||||||
| 0 | 0 |
|
|
|
|
|
|
| IPAIR | NAME | SHIFT | NEWSHIFT | S/N | NAME | SHIFT | NEWSHIFT | S/N |
| 0 | 19490040 | 0.486755 | 0.00000 | 18.1458 | 19490041 | 0.00185211 | 0.484903 | 18.1988 |
| 1 | 19490043 | 0.483834 | 0.00292102 | 18.4668 | 19490042 | 0.000856916 | 0.485898 | 18.5185 |
| 2 | 19490039 | 0.485517 | 0.00123802 | 18.2056 | 19490038 | 0.00000 | 0.486755 | 18.3099 |